Genuine Progress Indicator GPI v GDP

The Genuine Progress Indicator (GPI) is an attempt to measure the real increase in economic welfare.

The GPI measures the improvement in economic welfare – costs associated with growth. It is measured using the formula

GPI = A + B – C – D + I

  • A is income weighted private consumption
  • B is value of non-market services generating welfare
  • C is private defensive cost of natural deterioration
  • D is cost of deterioration of nature and natural resources
  • I is an increase in capital stock and balance of international trade

The GPI takes a wider measure of economic indicators into consideration. For example, GPI includes

  • value of voluntary work and unpaid work.
  • value of leisure time
  • Distribution of income
  • Impact on the environment
  • Environmental standards
  • Cost of crime

See list at the bottom for more details.

Advantages of Using GPI

  1. GDP doesn’t take into account negative externalities of growth. Higher GDP may lead to a large rise in pollution, crime and congestion leaving people with lower economic welfare and lower levels of happiness. Therefore, GDP can be misleading as an account of economic welfare.
  2. By focusing on a wider measure of economic indicators, it encourages policymakers to think in broader terms of economic welfare and not just crude GDP statistics.
  3. GDP only measures output – not how it actually affects people’s living standards and how it is used in society.
  4. Encourages long-term planning. i.e. sustainable growth rather than short-term measures which increase GDP at expense of damaging the environment.

Disadvantages of Using GPI

  • Many non-economic variables such as the value of leisure time/environment are very subjective and it can be difficult to assign an economic value. GDP is simpler and gives less normative results.
  • Not useful for judging the state of the business cycle.

Conclusion

Rather than GDP v GPI,  it is useful to use both and see them as complementary indexes. GDP will always have a use for economic accounting. However, it clearly has limitations. Using an additional measure such as GPI helps to give a better understanding of real economic development.

Read more

Problem of Cheap Alcohol

Deaths from liver disease have doubled in Britain in recent years while other countries such as France have seen “profound” falls thanks in part to “strict” rules on marketing drink, a strongly-worded article in The Lancet claims. Academics say that total deaths from the “wider harms” caused to society by alcohol could reach 250,000 in …

Read more

Gas and Electricity Inflation in UK 2011

Source:  ONS This graph shows how inflation rates for different categories can vary enormously. Firstly, gas and electricity prices are by far the most volatile. This reflects the volatile nature of supply, it also reflects the fact demand and supply are inelastic. See: volatile food prices for the economic theory behind this volatility. Despite the …

Read more

Forecast for Sterling to Dollar 2011

Though the UK economy may appear very weak to British consumers who are facing tax rises and spending cuts, there are various reasons which explain why sterling has recently been stronger and could continue its upward movement. Prospect of Higher Interest rates. With one of the highest inflation rates in Europe, and higher than US, …

Read more

Mrs Thatcher’s speech on U Turns in Economic Policy

In 1980, Mrs Thatcher made a memorable speech. “To those waiting with bated breath for that favourite media catchphrase, the U-turn, I have only one thing to say: You turn if you want to. The lady’s not for turning!”(BBC Link) Background – The economy was struggling under the deflationary fiscal and monetary policy. Mrs Thatcher …

Read more

A Worse Trade Off

In economics, there is often a trade off between macro economic variables. A simple trade off could be – increase interest rates; this leads to lower inflation, but also lower output. Cut interest rates, and you help boost growth, but increase inflation. In an ideal world, we would have low inflation, high growth and full …

Read more

Higher Inflation – Lower Growth

The latest inflation figures show a rise in inflationary pressure. CPI has increased from 3.3% to 3.7%. This places inflation considerably above target. Some commentators are now worried there is a danger the MPC could lose credibility in combating inflation. Just to further illustrate the dilemma for the MPC, the rise in inflation is being …

Read more

UK Balance of Payments Chart

currentaccount
See: Factors affecting UK Current account deficit.

Post updated Feb, 2011.

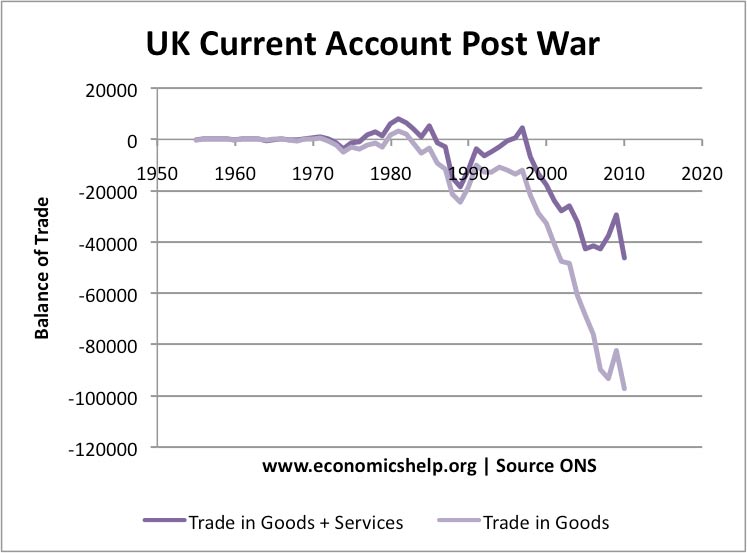
The UK has had a persistent current account deficit for the past couple of decades. The deficit has never gained much concern from politicians or economists. However, with the recent increase in the size and significance of the deficit there are an increasing number of Economists warning that a current account deficit can pose a threat to long term growth

bop

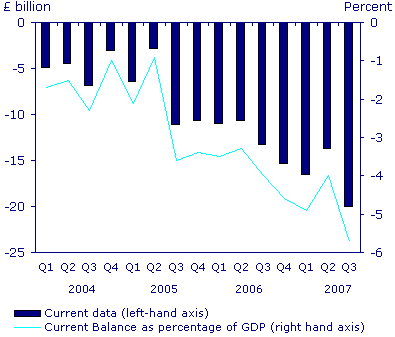
The data shows a sharp deterioration in the third quarter of 2003. This quarterly deficit is equivalent to 5.1% of GDP.

Read more

Item added to cart.
0 items - £0.00