Readers question: What is a ‘dual economy’?
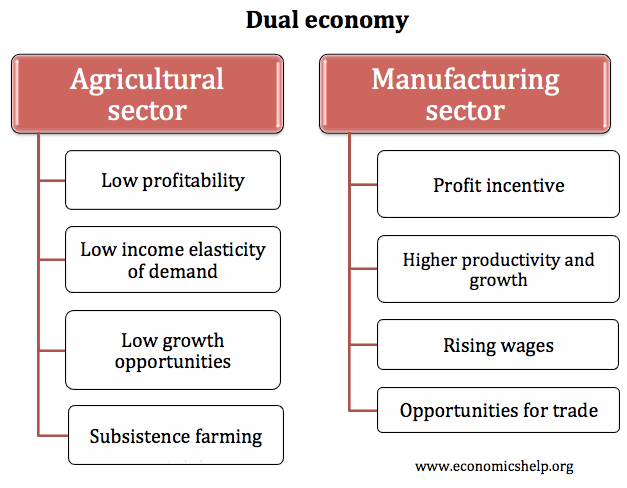
A dual economy refers to the existence of two distinct types of economic segments within an economy. This involves:
- A capitalist based manufacturing sector (geared towards global markets)
- Labour intensive agricultural sector (low productivity, geared towards subsistence farming or local markets)
The British economist W. Arthur Lewis wrote an influential paper on the ‘dual economy’ in 1954. He observed that in many developing economies (usually a former colonial country) that the economy was split into these different two segments.
The bulk of the economy was a labour intensive agricultural sector producing primary products. Lewis observed that in the agricultural sector, productivity was often very low, and farmers often lacked the traditional profit incentive and dynamism usually found in a free market economy.
Alongside this agricultural sector was a smaller manufacturing sector, which tended to have higher productivity. Firms in the manufacturing sector were often set up by foreign colonial powers.
It was not just that developing economies had different sectors, but that the different sectors had different economic motivations. Labourers in the agricultural sector usually lacked education, access to capital and had poor prospects for income growth. Agriculture was also focused on meeting the needs of local markets or subsistence farming and was insular in outlook. In the other manufacturing sector of the economy, there was a greater dynamism and an incentive to increase profits through expansion and investment. The manufacturing sector also faced greater global competition which spurs efficiency growth.
The dual nature of the economy may have been heightened by the fact manufacturing firms were set up / managed by owners from developed capitalist economies in the northern hemisphere.
Lewis argued that given the disparity in productivity, developing economies could make substantial economic growth by encouraging labour to move from the unproductive agricultural sector to the more profitable and productive manufacturing sector. Developing countries which concentrated on just agriculture were doomed to low savings, low productivity and low growth.
Another issue with a dual economy was that there is a potential problem from concentrating on agriculture exports. Agricultural goods tend to have a low-income elasticity of demand and are price inelastic. If a developing economy increases the output of agricultural products, this increase in supply is likely to depress prices and lead to lower export revenue. Because demand is price inelastic, they would make more revenue by restricting supply and keeping prices high. This is another reason to diversify out of agriculture and not just concentrate on agricultural output.