Aggregate demand (AD) is the total demand for goods and services produced within the economy over a period of time.
Aggregate demand (AD) is composed of various components.
AD = C+I+G+ (X-M)
- C = Consumer expenditure on goods and services.
- I = Gross capital investment – i.e. investment spending on capital goods e.g. factories and machines
- G = Government spending e.g. spending on NHS, education. Note transfer payments in the form of pensions and unemployment benefits are not included because they are not related to output produced.
- X = Exports of goods and services. Goods leave the country but money from abroad flows into the economy. Therefore this is an increase in AD (an injection into the circular flow)
- M = Imports of goods and services, although goods enter the country money is leaving the economy to go to other countries. Therefore AD falls.
AD slopes downwards because
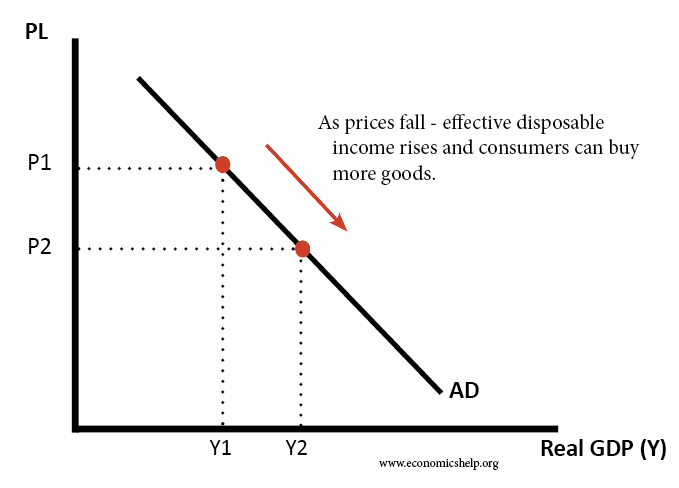
- At a lower price level, people are able to consume more goods and services, because their real income is higher.
- At a lower price level, interest rates usually, fall causing increased AD.
- At a lower price level, exports are relatively more competitive than imports.
Shifts in the aggregate demand curve
Graph to show increase in AD
An increase in AD (shift to the right of the curve) could be caused by a variety of factors
1. Increased consumption:
- An increase in consumers wealth (higher house prices or value of shares)
- Lower Interest Rates which makes borrowing cheaper, therefore, people spend more on credit cards. Also, mortgage payments are cheaper which gives people more disposable income.
- Higher wages
- Lower Taxes
- Increased consumer confidence about the future
Consumer expenditure accounts for about 66% of AD and therefore is a very important component of AD
2. Increased Investment
- Lower interest rates, this makes borrowing for investment cheaper.
- Increased confidence in the economic outlook
- Improved technology
- Increased economic growth, to meet increased demand firms need to increase capacity
3. Increased G
- Government pursues expansionary fiscal policy
- Government invests in infrastructure
4. Increased X
- The UK more competitive, for example, an increase in labour productivity would make the UK more competitive
- Increased growth in other countries, therefore they will have higher demand
- Lower value of Sterling, this makes exports cheaper
5. Decreased M
- The UK more competitive, this makes goods from other countries appear less competitive.
- Lower value of Sterling, this makes imports more expensive
- Lower GDP, therefore consumers will have less money to spend.
Fall in AD
![]()
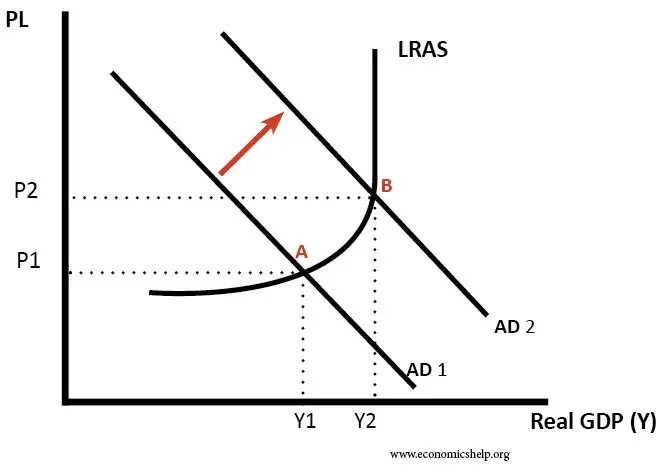
In this diagram, we see a fall in AD. This causes a fall in real GDP and a fall in the price level (P1 to P2)

In this diagram, the fall in AD has mainly caused a fall in the price level, with little change in real GDP.

Components of AD

Components of aggregate demand as %
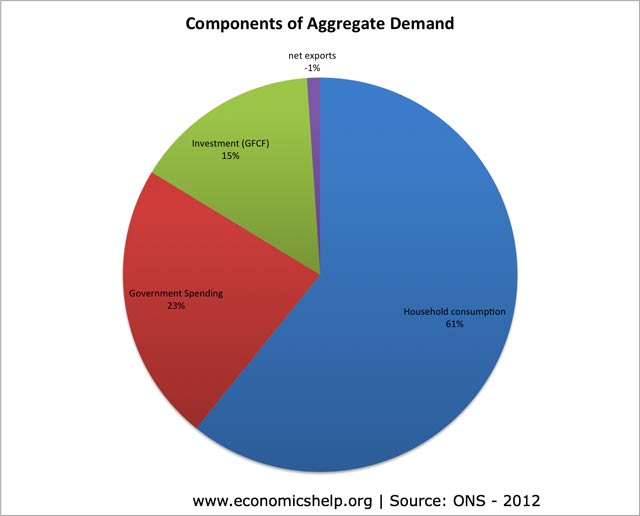
A graph showing components of AD as a %
In the above charts, I left out two minor factors NPISH and change in inventories to make it simpler.
Related