Price Elasticity of Demand (PED)

price-elasticity-demand-formula

Definition: Price elasticity of demand (PED) measures the responsiveness of demand after a change in price. Example of PED If price increases by 10% and demand for CDs fell by 20% Then PED = -20/10 = -2.0 If the price of petrol increased from 130p to 140p and demand fell from 10,000 units to 9,900 …

Read more

Diagrams for Supply and Demand

rise-in-supply-fall-demand-arrows

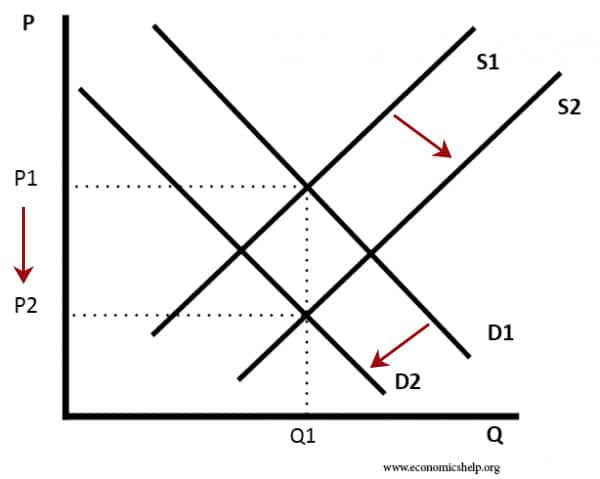
This is a collection of diagrams for supply and demand. It is mainly for my benefit, so when creating a post, like the price of tea (or when I’m teaching online) I can easily find a suitable diagram to illustrate what is happening. Demand curve  A contraction on the demand curve is due to higher …

Read more

Income Elasticity of Demand (YED)

normal-luxury-inferior-good

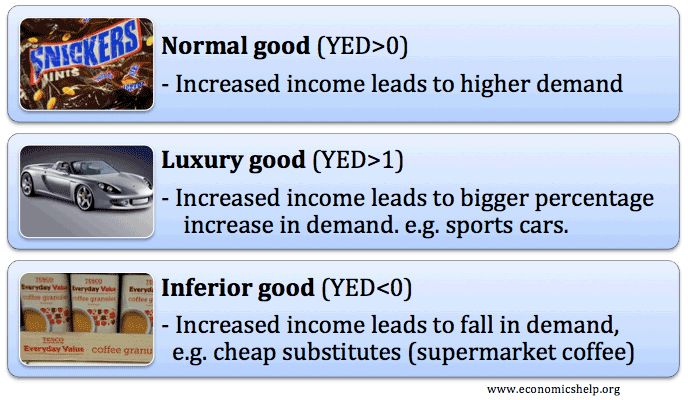
Income elasticity of demand (YED) measures the responsiveness of demand to a change in income. For example, if your income increase by 5% and your demand for mobile phones increased 20% then the YED of mobile phones = 20/5  = 4.0 Definition of Inferior Good This occurs when an increase in income leads to a …

Read more

Shift in Demand and Movement along Demand Curve

shift-in-demand

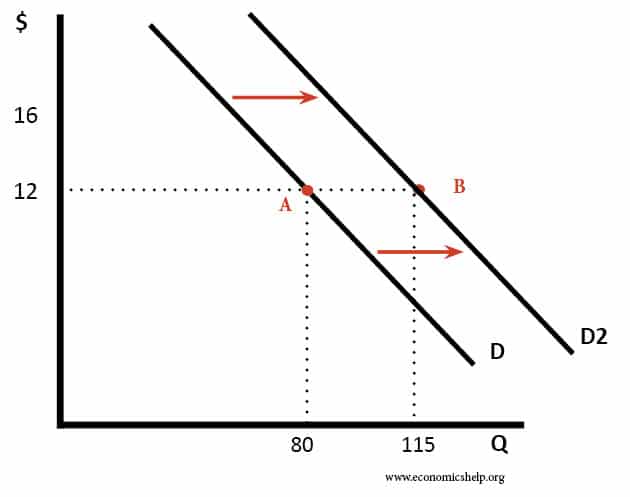
A shift in demand means at the same price, consumers wish to buy more. A movement along the demand curve occurs following a change in price. Movement along the demand curve A change in price causes a movement along the demand curve. It can either be contraction (less demand) or expansion/extension. (more demand) Contraction in …

Read more

Demand for money

The demand for money refers to how much assets individuals wish to hold in the form of money (as opposed to illiquid physical assets.) It is sometimes referred to as liquidity preference. The demand for money is related to income, interest rates and whether people prefer to hold cash(money) or illiquid assets like money. This …

Read more

Kinked demand curve

kinked-demand-curve

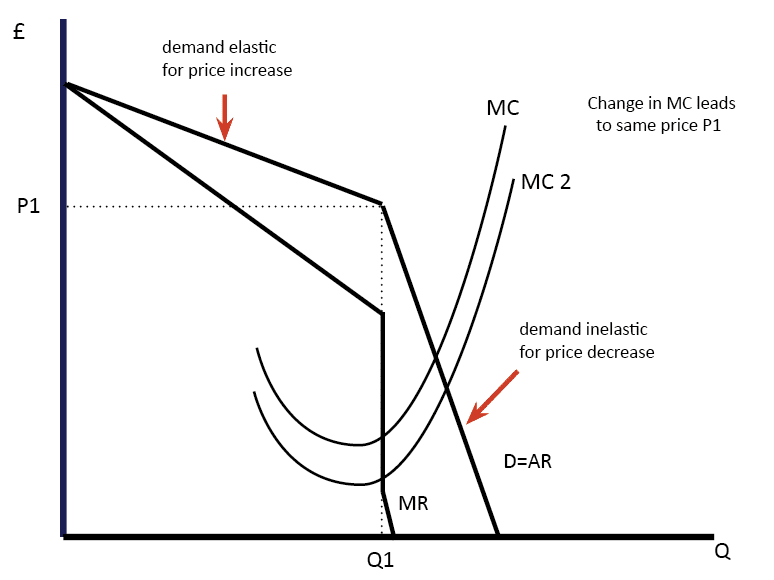
A kinked demand curve occurs when the demand curve is not a straight line but has a different elasticity for higher and lower prices. One example of a kinked demand curve is the model for an oligopoly. This model of oligopoly suggests that prices are rigid and that firms will face different effects for both …

Read more

Example of plotting demand and supply curve graph

The demand curve shows the amount of goods consumers are willing to buy at each market price. An individual demand curve shows the quantity of the good, a consumer would buy at different prices.     Plotting price and quantity supply     Market equilibrium     More demand curves Related Factors affecting demand Demand …

Read more

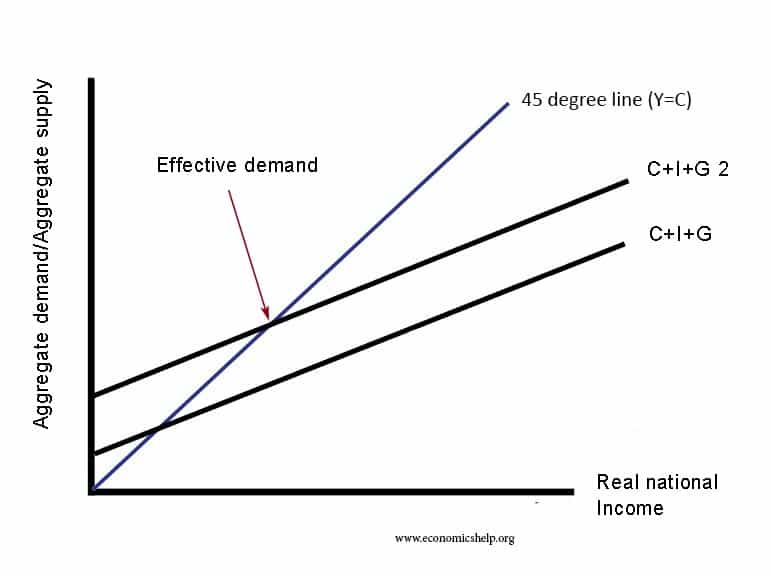
Effective demand

consumption-function-effective-demand

Effective demand refers to the willingness and ability of consumers to purchase goods at different prices. It shows the amount of goods that consumers are actually buying – supported by their ability to pay. Effective demand excludes latent demand – where the willingness to purchase goods may be limited by the inability to afford it …

Read more

Item added to cart.
0 items - £0.00