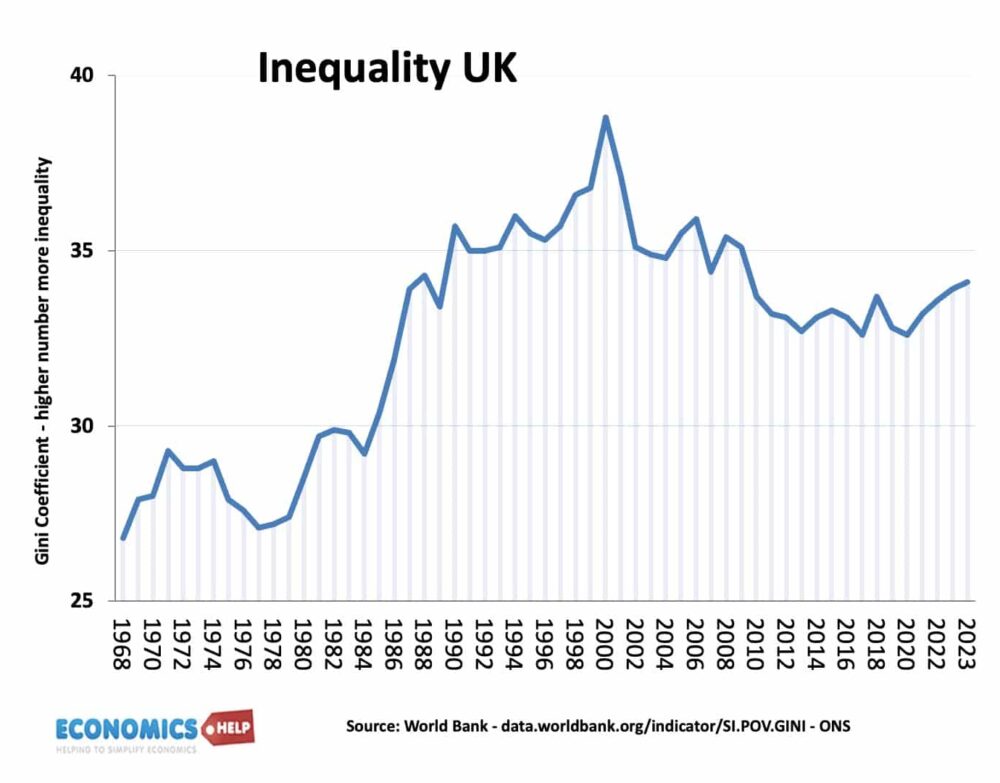
In the nineteenth century, the UK was characterised by high levels of income inequality. However, from the start of the twentieth century until 1978, there was a steady fall in inequality and reduction in poverty (both relative and absolute). However, the 1980s saw a sharp rise in inequality which has not been reversed in the 1990s and 2000s.
Reasons for post-war fall in inequality
- Welfare state – benefits for the unemployed, sick
- Higher income taxes on high earners
- Period of full employment
- Rising wages for the working class.
- Erosion of class privileges
- Improvement in universal education and universal health care.
- See also: post-war economic boom
Income inequality measured by disposable income
The gini coefficient is a measure of income inequality. It measures the ratio in a https://www.economicshelp.org/blog/glossary/lorenz-curve/Lorenz curve between the line of equality and line of actual income. A ratio of 100% is extreme inequality a ratio of 0% is perfect equality.
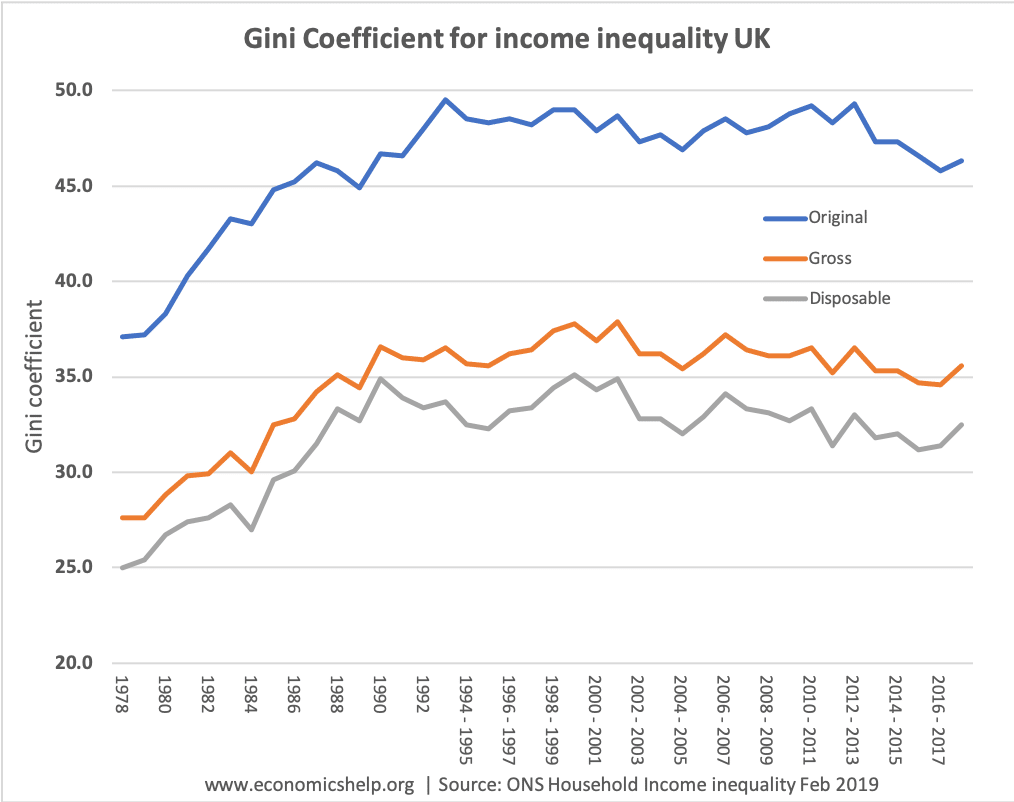
The below graph shows the rise in inequality from 1978 to 1992.
Gini coefficient is one popular method of measuring inequality but it doesn’t always reflect how the inequality is distributed.

Source: ONS
Reasons for rise in income inequality during the 1980s
- Reduced power of trade unions
- Decline in manufacturing and relatively high paying manual labour
- Rise in service sector jobs characterised by short-term contracts, flexible hours.
- Reduction in higher income tax rates
- Benefits index linked means benefits rose more slowly than average wages
- Growth in financial sector and number of high paying jobs in the industry.

Source: ONS
Income inequality of top 1%

From mid-1970s to late 1990s, there was a sharp reversal in income inequality, especially the top 1% saw a marked increase in the share of overall income. This was because:
- Growth of financial sector and growth in wages for high earners
- Privatisation and deregulation, especially deregulation of financial sector
- Growth in asset prices (houses) which increased wealth inequality
- Decline of manufacturing industry and rise in long-term unemployment
- Growth in wage inequality
- Cut in higher rates of income tax
Inequality in UK compared
The UK has one of the highest levels of inequality in the developed world.

Source: IFS
Historical inequality
Data from the past is harder to find.
The inverted Pareto – Lorenz coefficient is a measure of inequality.
Note there are gaps in the series. The measure of inequality was highest in 1910 at 2.9
This measure of inequality fell sharply after the war before increasing from 180.
Income share of top 1%

Relative Poverty
Since 1997, there has been a fall in absolute low income. Relative low income has only d

The number of people living in relative poverty (defined as income 60% of median average incomes) stands at 12.8 million (after housing costs) This is approximately 21% of the population, down from 25% in 1997 (poverty and inequality in the UK 2007)
Factors that may have contributed to increased inequality in the UK in recent years
1. An increase in the number of people on benefits. Despite falling unemployment, the number of people receiving state benefits is still around 5 million. There has been an increasing number of people on state benefits such as sickness and incapacity benefits. Arguably there is disguised unemployment. This means that many people have lower incomes.
2. Rising property values have reduced disposable incomes for many young people. Rising property values have made renting more expensive. Therefore, an increasing % of incomes has been spent on housing costs. There has also been an undeniable increase in wealth inequality, which often leads to income inequality.
3. There has been an increase in part-time /temporary work. This work is not protected by trades unions and tends to be low paid.
4. The minimum wage is limited in its ability to reduce inequality. Many of those who benefit from the NMW are second income earners or students who are not particularly poor.
5. Increase in regressive indirect taxes. Taxes on alcohol, petrol and cigarettes have increased faster than inflation. Therefore, they have been taking a higher % of people’s disposable income. This has particularly affected groups such as the single unemployed.
6. Inflation for pensioners has been higher than the CPI rate. This is because pensioners spend a higher % of income on goods like council tax, fuel and food; these goods have been increasing faster than inflation, leaving pensioners relatively poorer.
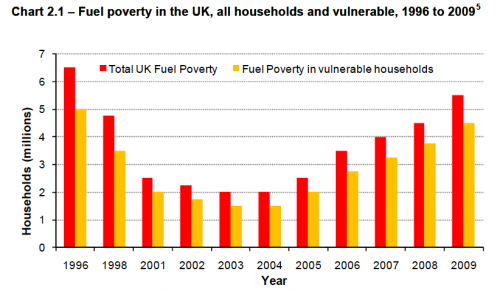
Fuel Poverty
Fuel poverty occurs when households have to spend more than 10% of their income on maintaining the home at a reasonable temperature.
OECD Report
An OECD report suggested, according to the Gini coefficient, inequality had grown in the UK quicker than anywhere else.
In Britain, the gap in earnings between the richest and poorest in the working-age population has risen from eight to one in 1985 to 12 to one in 2008.
Workers in the top tenth now earn an average £55,000 a year, compared with £4,700 for the poorest 10 percent.
Using a measurement which works out how well income is distributed throughout society, known as the Gini coefficient, inequality has risen faster in Britain than in any other country since 1975.
The reason for this increase is mainly down to the fact that the share of total income taken by the richest 1 percent has doubled, from 7.1 percent in 1970 to 14.3 percent in 2005. Within this group, the super-rich 0.1 percent of top earns took some 5 percent of total pre-tax income.
Welfare State
However, the OECD also pointed out that UK government spending on health and education had the impact of helping to reduce effective inequality.
Wealth Inequality
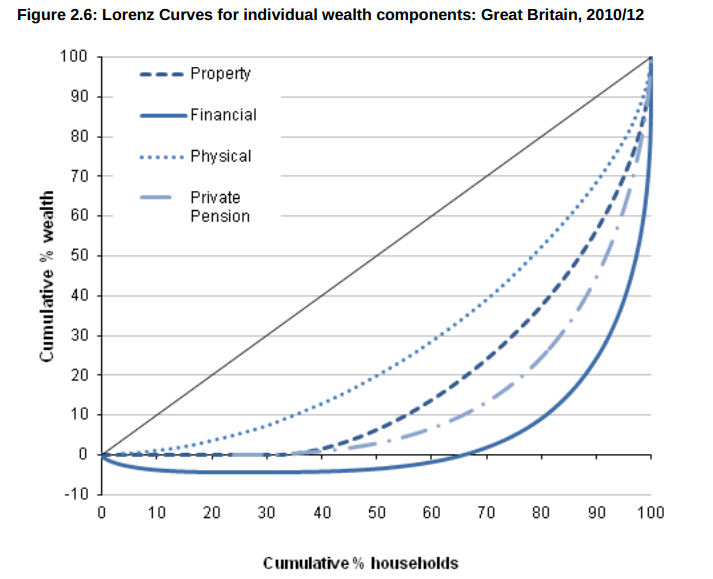
The Lorenz curve shows the cumulative wealth of each wealth decile. It shows that the lowest 38% of individuals have zero property wealth. The top 10% own nearly 50% of property wealth.
With financial wealth, the inequality is even greater. WIth 60% of the population in debt and negative wealth. The top 10% have 80% of the nations financial wealth.
Source:
- Wealth in Great Britain ONS, published July 2012
Other graphs of inequality
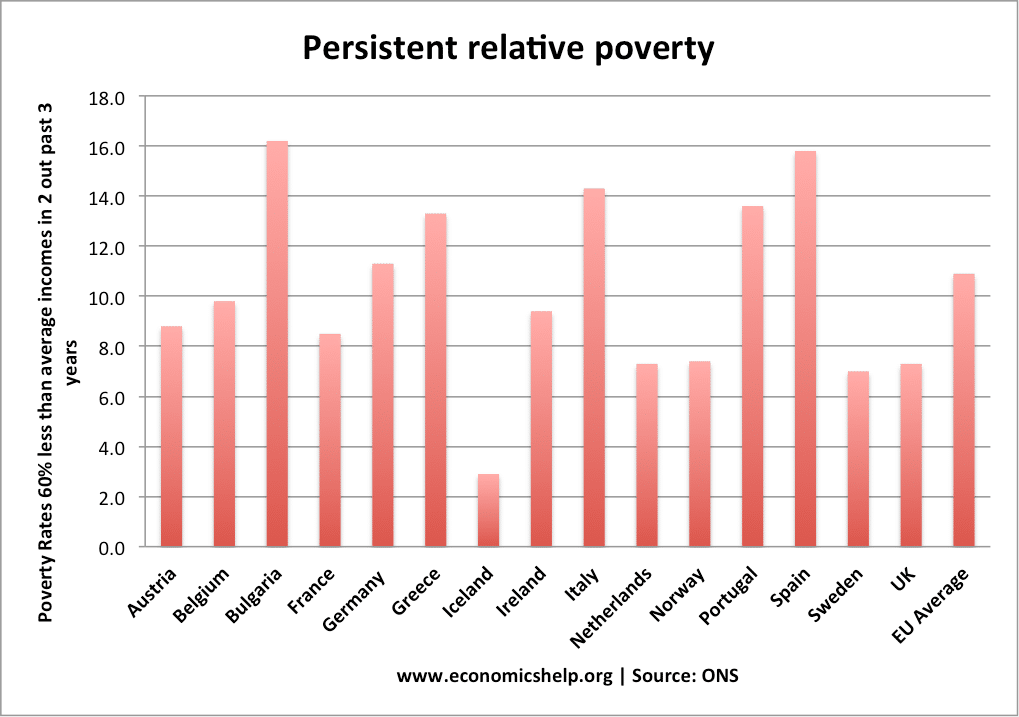
UK compared to EU average.
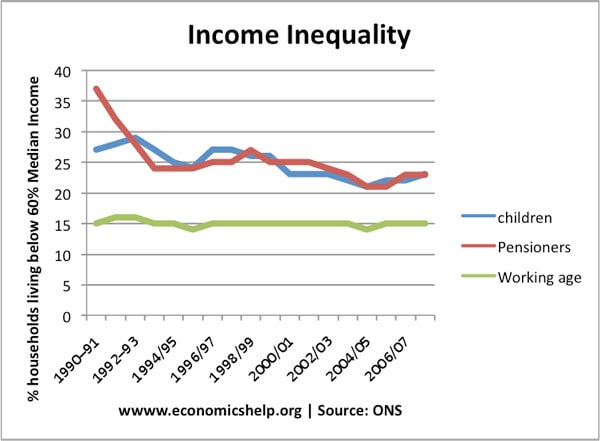
Since 1990, there has been a reduction in pensioner poverty – the state pension has risen faster than inflation and housing costs have risen faster for the young.
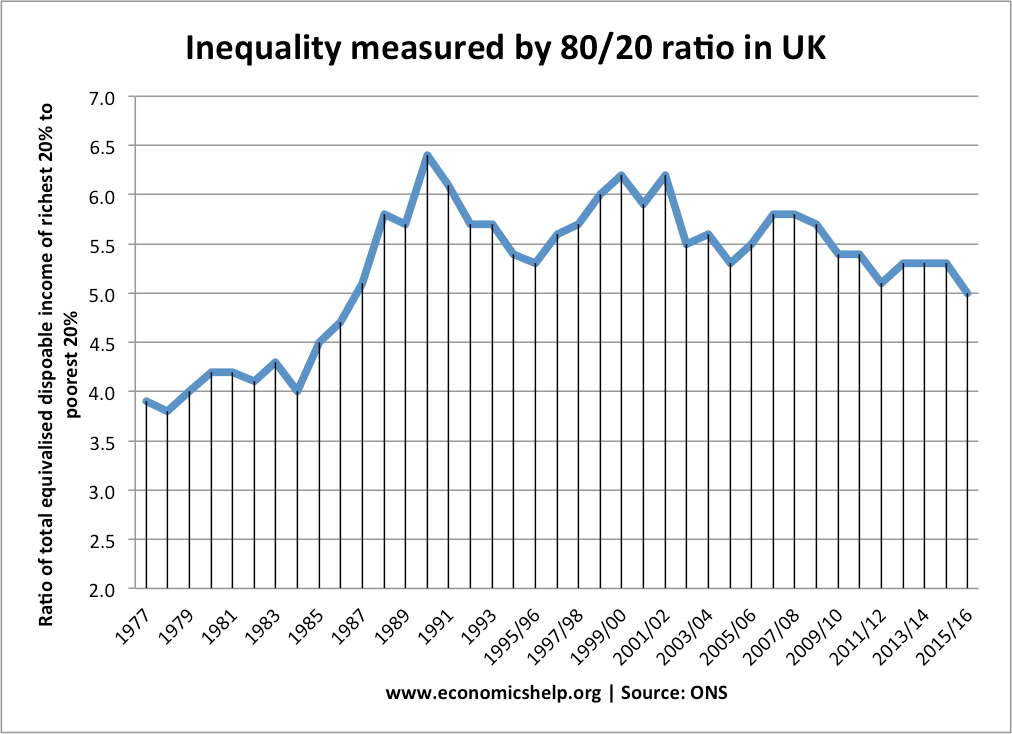
This shows inequality measured by the ratio of top 20% richest people to bottom 20%. Since 1991, there has been a minor reduction in this level of poverty.
Related
Hi. I am a devoted fan, and recommend your site more than any other to my online tuition students.
I wonder whether you are planning to update this “Inequality in UK” page to 2018 or 2019? Most of the graphs go up to 2012 but it’s an increasingly ‘hot’ issue and I think things have got a lot worse since then.
Many thanks and best wishes,
Francis Cubitt