
Break-even analysis examines the point at which a firm’s total revenue equals its total costs, meaning it makes no profit and no loss. This is sometimes known as normal profit.
It is based on separating costs into fixed costs, which do not vary with output, and variable costs, which rise as production increases. The break-even point tells a firm how many units it must sell to cover all costs.
The core formula is:
Break-even output = Fixed Costs ÷ (Price – Variable Cost per Unit).
Price – variable cost per unit is known as the contribution per unit. It reflects the ‘contribution’ towards paying the fixed costs.
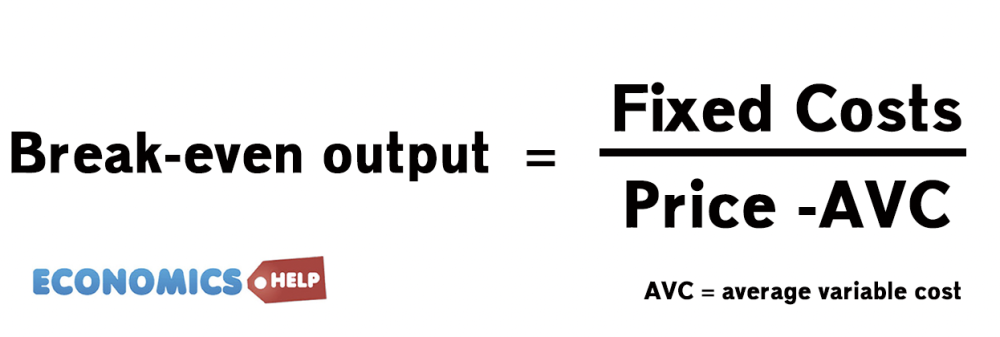
The denominator is the contribution per unit — the amount each unit contributes towards covering fixed costs. Once fixed costs are covered, each additional sale contributes directly to profit.
Break-even example
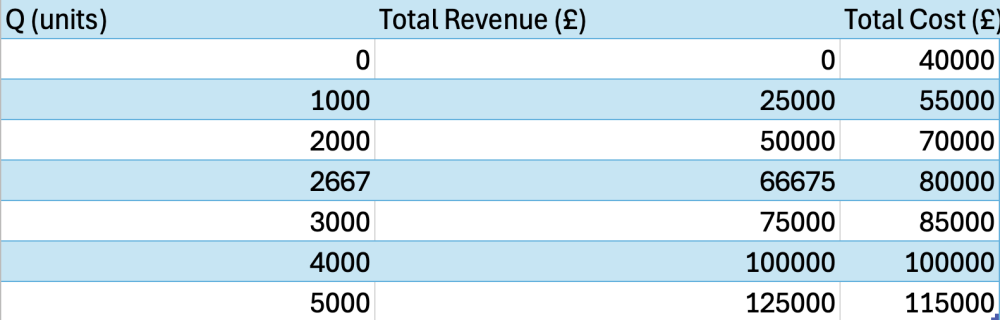

A break-even chart plots total revenue and total costs against output. The point where these lines intersect is the break-even output (4,000 in this example) To the left of this point, the firm makes a loss; to the right, a profit. The margin of safety (actual output minus break-even output) shows how far output can fall before the firm returns to losses.
Example of Break-even Calculation
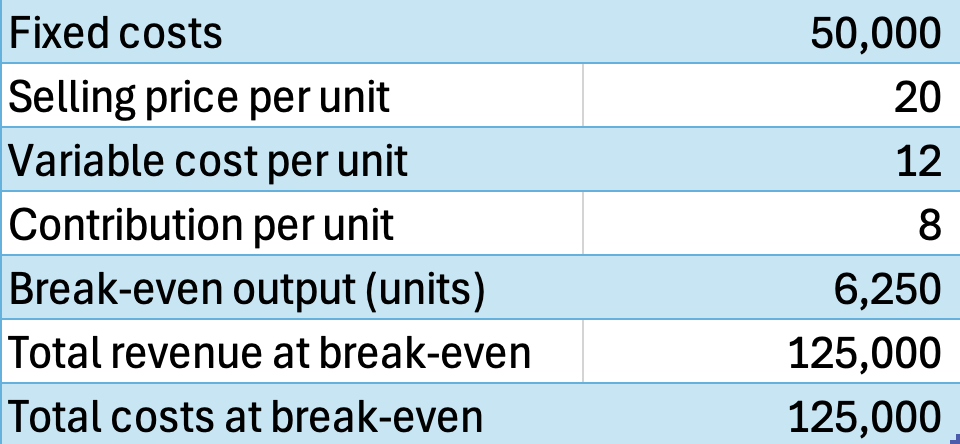
- Fixed costs: £50,000
- Selling price per unit: £20
- Variable cost per unit: £12
Step 1: Calculate contribution per unit
Contribution = Price – Variable Cost = £20 – £12 = £8
Step 2: Break-even output
Break-even = Fixed Costs ÷ Contribution
Break-even = £50,000 ÷ £8 = 6,250 units
Explained
The firm must sell 6,250 units to cover all costs. At this level:
- Total revenue = 6,250 × £20 = £125,000
- Total costs = Fixed £50,000 + (6,250 × £12 = £75,000)
- Profit = £0
Margin of Safety Calculation
If the firm sells 8,000 units:
- Revenue = 8,000 × £20 = £160,000
- Variable costs = 8,000 × £12 = £96,000
- Total costs = £96,000 + £50,000 = £146,000
- Profit = Revenue – Total costs = £14,000
Margin of safety:
- = Actual output – Break-even
- = 8,000 – 6,250 = 1,750 units
This is the amount sales can fall before the firm returns to zero profit.
Usefulness of Break-even analysis
Break-even analysis helps with pricing decisions, assessing the viability of new products, and understanding cost structures. Its limitations are that it assumes a single selling price, fixed costs that stay constant, and all output being sold — assumptions that may not always hold in real-world markets.
Break-even Analysis with AC diagrams
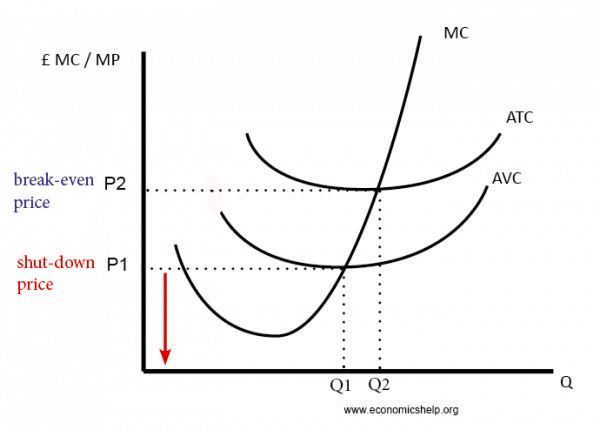
- ATC = average total cost = variable + fixed costs
- AVC = average variable cost
- AR = average revenue
From the above diagram
- If AR > ATC The firm is making supernormal profits
- If AR= ATC The firm is making normal profits. This is the ‘break-even’ price.
- If AR< ATC but AR > AVC. it is making an operating profit and is covering its variable costs. However, it is making an economic loss because it can not cover its fixed costs as well. At this level (P1-P2) In the short run, it is best to keep producing because it has already paid for its fixed costs. It is at least making a contribution to its fixed costs
- If AR < AVC The firm is likely to shut down in the short run.
About The Author
