What gives the best investment? If we take 2000 as a starting point, we find that gold has done the best. The main asset classes, this are the nominal wealth increases
However, the choice of date is important. 2001 saw a crash in shares and gold was at a low point. The past 26 years are a good time frame, but if you chose past 50 year time frame, it would look quite different.
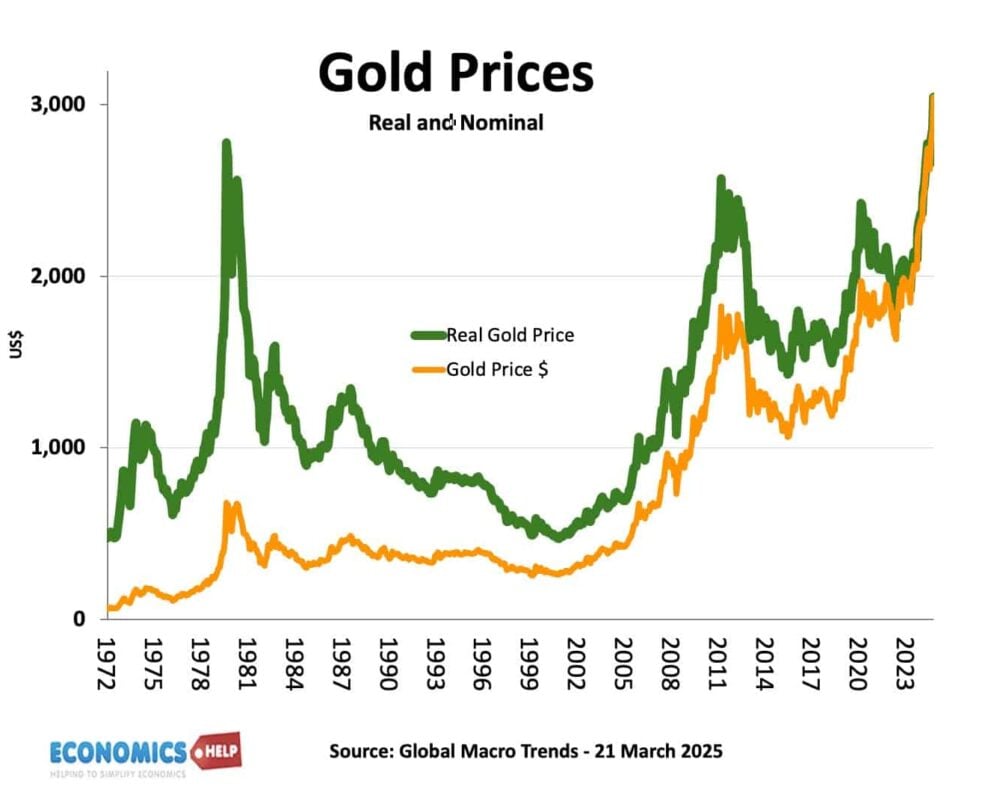
This shows the gold price since 1972, the striking thing is how much the inflation adjusted price fell from 1980 to 2000. 2000 was a very good time to buy gold. But, historically, the price of gold can go down as well as up.
However, with those caveats in place, this gives an idea how your investment money would have behaved since 2000
Stocks vs Gold: Annualised Returns (2000–2025)
Nominal returns (not inflation-adjusted). Stocks are S&P 500 Total Return (dividends reinvested). Gold is spot price.
US Stocks (S&P 500 TR)
8.51% p.a.
CAGR (2000→2025)
£1 invested in 2000 becomes:
£7.7
Relative “wealth multiple” bar (vs gold)
Gold (spot price)
10.70% p.a.
CAGR (2000→2025)
£1 invested in 2000 becomes:
£12.7
Relative “wealth multiple” bar (gold = 100%)
Why did gold beat stocks in this window?
Starting in 2000 captures the dot-com peak for equities, followed by two major crashes and post-2020 inflationary stress — conditions where gold often shines.
Source: Visual Capitalist (BullionVault partnership) shows $10,000 in 2000 becomes ~$77,000 in S&P 500 TR vs ~$127,000 in gold by 2025.
Note: Approximate; depends on exact start/end dates and methodology.
Real returns
If we take into account inflation, the returns are lower, though the basic principle is the same.
Stocks vs Gold: Real Returns (2000–2025)
Inflation-adjusted using US CPI (2000: 172.2 → 2025: 322.3; inflation factor ≈ 1.872×).
US Stocks (S&P 500 TR)
5.82% p.a.
Real CAGR (2000→2025)
£1 invested in 2000 becomes (in 2025 £):
£4.11
Relative “real wealth multiple” bar (vs gold)
Gold (spot price)
7.96% p.a.
Real CAGR (2000→2025)
£1 invested in 2000 becomes (in 2025 £):
£6.79
Relative “real wealth multiple” bar (gold = 100%)
Inflation makes a big difference
Nominal wealth gains look larger than the purchasing-power gains. From 2000 to 2025, the CPI rose from 172.2 to 322.3.
Sources: (1) Wealth multiples for stocks vs gold from Visual Capitalist / BullionVault. (2) CPI values from Federal Reserve Bank of Minneapolis CPI table.
Note: Real returns computed by dividing the nominal wealth multiple by the CPI inflation factor, then converting to CAGR.
Inflation factor compounded from the same sheet (2000–2025): 1.93× (≈ +93%). Real (inflation-adjusted) wealth multiples: Stocks 3.83×, Houses 1.71×, Bonds 1.38×, Cash 0.85×, Gold 7.76×.
Investing since 2000: Stocks vs Houses vs Gold vs Bonds vs Cash (to end-2025)
Nominal annualised returns (CAGR). Stocks are S&P 500 total return; cash is 3-month T-bill; bonds are 10-year Treasury; houses = “Real Estate”; gold = “Gold”.
Gold
10.96% p.a.
CAGR (2000→2025)
£1 in 2000 becomes:
£14.95
Wealth multiple (gold = 100%)
US Stocks (S&P 500 TR)
7.99% p.a.
CAGR (2000→2025)
£1 in 2000 becomes:
£7.39
Relative to gold
Houses (Real Estate)
4.70% p.a.
CAGR (2000→2025)
£1 in 2000 becomes:
£3.30
Relative to gold
Bonds (10-yr Treasury)
3.82% p.a.
CAGR (2000→2025)
£1 in 2000 becomes:
£2.65
Relative to gold
Cash (3-mo T-bill)
1.93% p.a.
CAGR (2000→2025)
£1 in 2000 becomes:
£1.64
Relative to gold
Note
These are nominal returns. A more realistic “purchasing power” view is shown in the real (inflation-adjusted) version below.
Source: Aswath Damodaran (NYU Stern), Historical Returns on Stocks, Bonds and Bills (annual series incl. S&P 500 total return, T-bills, 10-yr Treasuries, real estate, gold, inflation).
Tejvan Pettinger. Author of “Cracking Economics” “What Would Keynes Do?” – studied PPE Oxford University (1995-99) and works as an economics teacher and writer.