These are a few interesting graphs which give different perspective on the same situation. i.e. recent economic recoveries – looking at both UK and Spain.
Firstly, UK economic growth in the past four years.
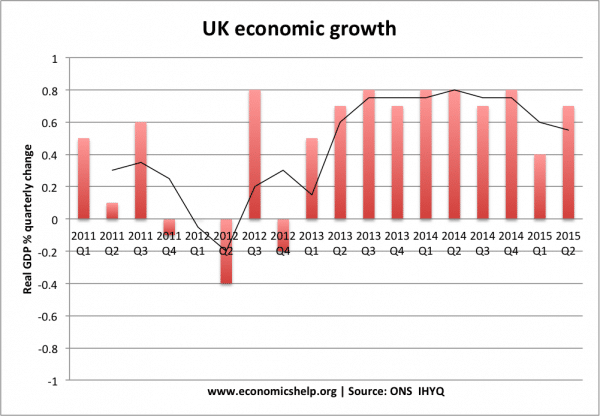
After weak / negative growth in 2011 and 2012, the UK has been growing at a quarterly rate of approx 0.6%. This equates to an annual rate of approx. 2.4% – which is very close to the UK’s long run trend rate of economic growth (2.5% is a figure often suggested)
However, when we look at lost output, the recovery looks less impressive
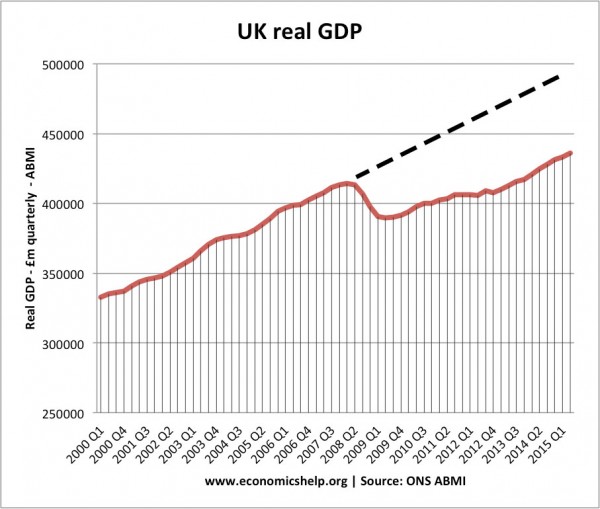
This lost potential output is a big issue.
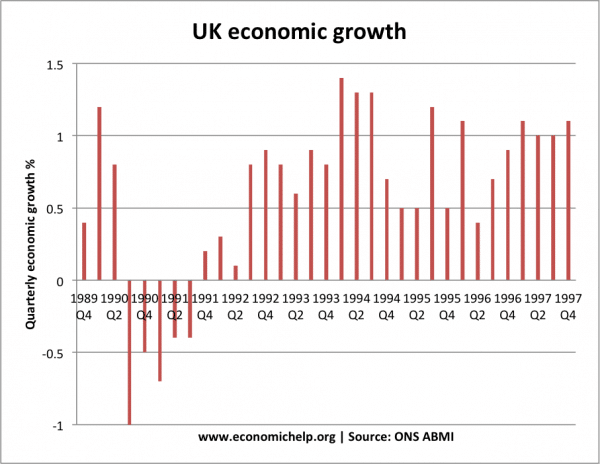
Usually, after deep recession we would expect a bigger bounce back. For example
After 1991 recession, we have a much stronger rebound – despite the shallower recession.
UK long run economic growth since 1963
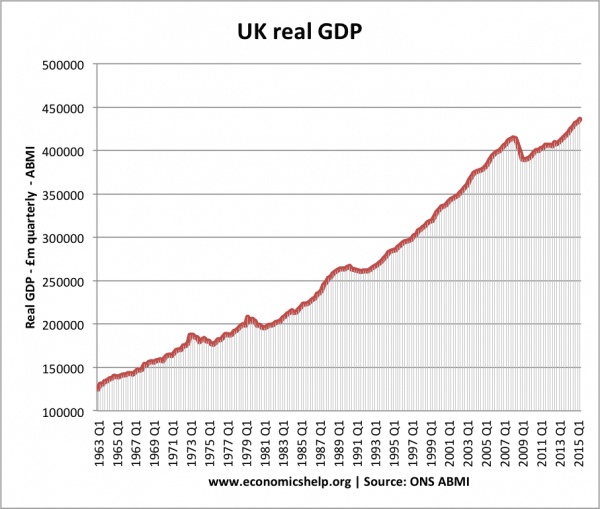
What happened to the lost UK output?
This is an important question.
Is the lost output of the past 8 years due to depressed aggregate demand and productive capacity not used – or is it permanently lost due to the effects of the prolonged recession and credit crunch.
It is probably both. Some output is probably lost forever.
But, inflation close to zero and very low wage growth suggests the UK economy still has spare capacity. But, exactly how much the negative output gap is – is a difficult question to precisely answer.
Lost output could have been worse – Spain
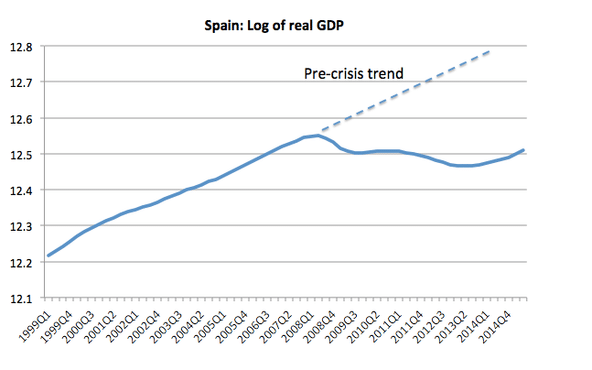
This is from Paul Krugman’s blog – under the post ‘Austerity Success Story‘ Here Krugman is trying to make the point that the recent positive economic growth in Spain is not necessarily vindication of what has happened in past eight years.
Related
