Economic Growth UK

Economic growth measures the change in real GDP (national income adjusted for inflation; ONS call it chained volume measure of GDP) Since the end of the great recession (2008 – 2009) the UK economy has grown in fits and starts. It has been a relatively weak economic recovery compared to previous recessions. 2019 has seen …

Read more

What explains differences in economic growth rates?

gdp convergence

Readers Question: Given the widely varying fiscal policies of countries, both left and right, how come their growth rates over the long term are so close? source: World Bank To some extent growth rates are close; though it also depends which data and countries you use. However, from a very broad perspective, growth rates do …

Read more

The Rahn Curve – economic growth and level of government spending

rahn-curve

Readers Question: Does the Rahn Curve support the empirical evidence? If not, why not? Can you prove that there is a relationship between the level of Government Spending and GDP growth? The Rahn Curve suggests that there is an optimal level of government spending which maximises the rate of economic growth. Initially, higher government spending …

Read more

Do we need economic growth in a modern economy?

real-gdp-1955

A look at whether we actually need economic growth in a modern economy. Readers Question: When I compare my life with my fathers at that time the conditions are near identical in the greater things or life. I work the same hours, maybe more. I have the same holidays. I have a similar standard of …

Read more

Recent economic growth compared to trend growth

These are a few interesting graphs which give different perspective on the same situation. i.e. recent economic recoveries – looking at both UK and Spain. Firstly, UK economic growth in the past four years. After weak / negative growth in 2011 and 2012, the UK has been growing at a quarterly rate of approx 0.6%. …

Read more

France vs UK recovery

Useful post from Paul Krugman about a comparison between the French and UK recoveries. It stems from comments by a Conservative cabinet minister that ‘the French economy is being run into the sand.’ For those who can’t get past the NY Times paywall, I’ll post the two graphs here. UK and France since 2010 The …

Read more

The recession is over but not the depression

Some thought provoking analysis from NIESR. Firstly, they define recession and depression in an interesting way.

  • Recession – a period of time where output is falling.
  • Depression – The period of time where output is below it’s peak.

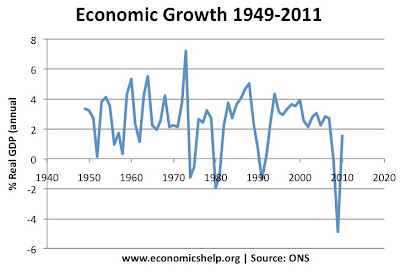
The UK economy is now growing, at a decent pace (0.8% in Q3). However, output is still significantly below the old 2008 peak. This means that the recession is over. But, with output still below the 2008 peak, the prolonged period of depression is still not over, according to this definition.

Also, if we compare this ongoing economic downturn (2008-2013) with other periods of serious economic stagnation, the UK economy is performing worse now than even the 1920s or 1930s.

NIERS - UK output
Source: NIERS

The NIERS don’t expect the 2008 GDP peak to be regained until 2015. Meaning, we will have a 7 year period of stagnating real GDP. An unprecedented length of economic stagnation. See also: more on comparison of different recessions

But, it doesn’t feel like a depression?

There are no commonly agreed definitions of what constitutes a depression. Most definitions tend to emphasise a significant fall in real GDP or a prolonged fall in GDP for a period of over 3 years. For example, if real GDP falls by over 10%, that would be classed as a depression. A depression also implies a very high rate of unemployment (perhaps greater than 15%).

The UK unemployment rate is relatively low by the standards of other recessions (helped by falling productivity and flexible labour markets) Therefore, with economic growth, and ‘reasonably’ low unemployment, it feels a different climate to the great depression of the 1930s.

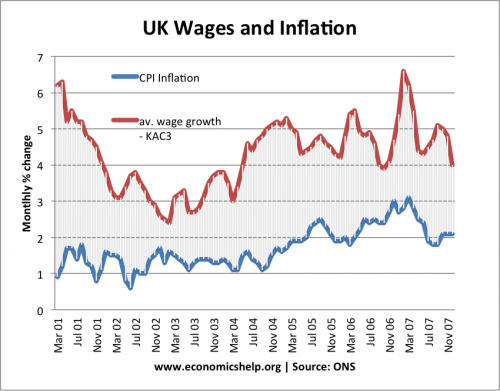
On the other hand, although unemployment could be much higher, there has been a widespread fall in living standards, which is unprecedented in the post war period. Figures show UK living standards have dropped to their lowest in a decade after average real incomes fell a further 3 per cent last year.

Read more

The Great Moderation

The great moderation refers to a period of economic stability characterised by low inflation, positive economic growth, and the belief that the boom and bust cycle had been overcome. In retrospect, economists look back on the great moderation in a different light because although inflation was low, there was great volatility in financial markets and asset prices.

inflation-growth-90-12
The UK great moderation from 1992 to 2008 low inflation, positive economic growth.

Generally, the great moderation refers to the period 1986 – 2006.

In the UK, the great moderation is considered to be the period 1993-2007 because the UK had a classic boom and bust in late 1980s and early 1990s. The UK experienced 63 consecutive quarters of economic growth between the end of the 1991 recession and the recession in 2008 – the longest continued expansion on record.

Wage growth

wages-inflation-2000-2007

This was typical of wage growth during the great moderation. Average wage growth above CPI inflation causing a steady growth in living standards.

Before the great moderation – boom and bust trade cycles


inflation

In the post war period there seemed to be a fairly consistent business cycle. Economies would experience, high growth (a boom), but with high growth came inflation. After a period of inflation, the economy would slow down and sometimes go into recession  (see boom and bust). It appeared the business cycle was volatile and inflation difficult to bring under permanent control. The 1970s, saw even greater volatility with oil shocks causing high inflation.

Features of the great moderation

After the volatility of the 1970s and 1980s, the great moderation was seen as a welcome end to this volatile growth and inflation. The great moderation had various aspects.

US inflation
US inflation, after early 1980s, inflation generally stays close to target of 2.5%
  • Low inflation. The most prominent feature of the great moderation was persistently low inflation. It appeared that Central Banks could keep  inflation low – without compromising unemployment or economic growth. The Phillips curve had either shifted to the left or was no longer relevant. There was a certain excitement that we were seeing the end of boom and bust.
  • Stable growth. With low inflation, we avoided the boom and bust cycles. The UK had their longest period of economic expansion on record 1992-2007. Apart from a minor dip in 2001, the US economy grew strongly during 1986-2006.
  • The end of uncertainty and greater risk taking. The benign macro economic situation encouraged investment in both capital and financial investments. During the 1980s and 1990s, there was a period of financial deregulation which encouraged a growth in complex financial derivatives, such as credit default swaps. Financial institutions became willing to take on more risky investments because they were more confident that there wouldn’t be any major economic downturn. Banks became more highly geared as they lent out a greater % of their assets. For more on how macro stability increased risk taking – see Financial instability hypothesis
  • Rising asset prices. Asset prices, especially houses, saw a rapid growth in prices. House prices rose because of low interest rates, a stable macro-economy, and growth of mortgage lending. House prices rose faster than inflation, and even faster than incomes. Some were worried house prices were becoming overvalued, but others felt house prices weren’t overvalued because of either limited supply or the growth of new mortgages meant more people could now afford to get a mortgage.

Read more

Item added to cart.
0 items - £0.00