The post 2008 recession has seen the longest decline in real GDP on record. 55 months after the peak output of 2008, the UK economy is still 4% below it’s peak. By contrast, in the same time frame during the early 1930s, the economy had recovered to be more than 2% higher than the 1930 peak.
The 2008-13 recession is longer lasting than even the great depression. Yet, curiously the 2008 recession has seen one of the least damaging rises in unemployment.
Firstly, a look at the percentage change in real GDP since peak output (just before when the recession started)
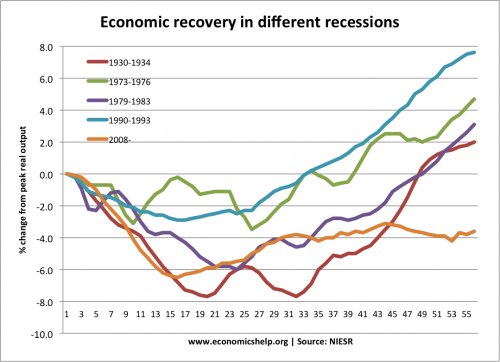
For the first 15 months, the decline in real GDP is comparable to the great depression of the 1930s. The great depression shows a bigger fall in GDP (-8.0%) from peak. But, after 33 months, the economy recovered quite strongly in the early 1930s. The experience in 2008-13 shows a rare continued stagnation.
Unemployment in different recessions
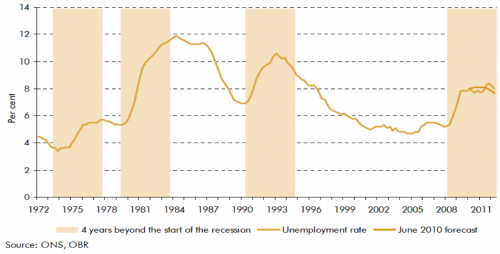
This shows that the rise in unemployment has been relatively muted during the 2008 recession. In 2008-12, There has been a surprising growth in private sector employment – despite weak private sector investment and spending.
See: reasons to explain the UK unemployment mystery
Hours worked in different recessions
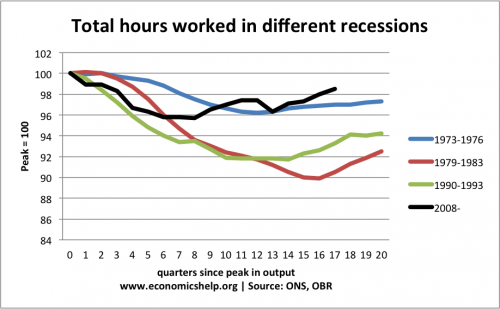
This shows that 17 quarters after the peak GDP, employment levels have fared better in 2008 than in other recessions. A rising population may be one factor, but the muted rise in unemployment suggests that the labour market in 2008-13 has proved more resilient and more flexible than many might have expected.
Productivity levels in different recessions
One consequence of the relatively ‘better’ employment situation is that it has been partly achieved through lower productivity. Productivity growth in this recession has been stagnant (see more on productivity stats during recent years). This suggests firms have been more willing to hold onto less productive workers. (e.g. faced with falling output, firms more willing to keep workers employed). This has been helped by very weak wage growth in this recession.
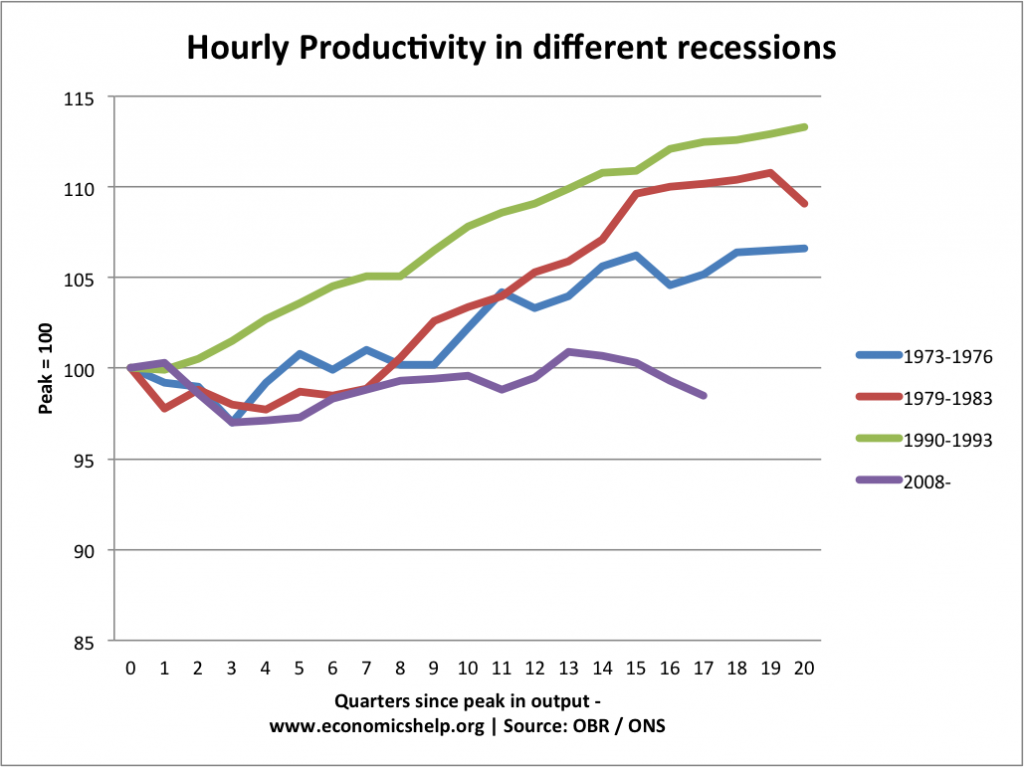
The 2008 recession is by far the most disappointing recession in terms of hourly productivity.
Inflation during different recessions
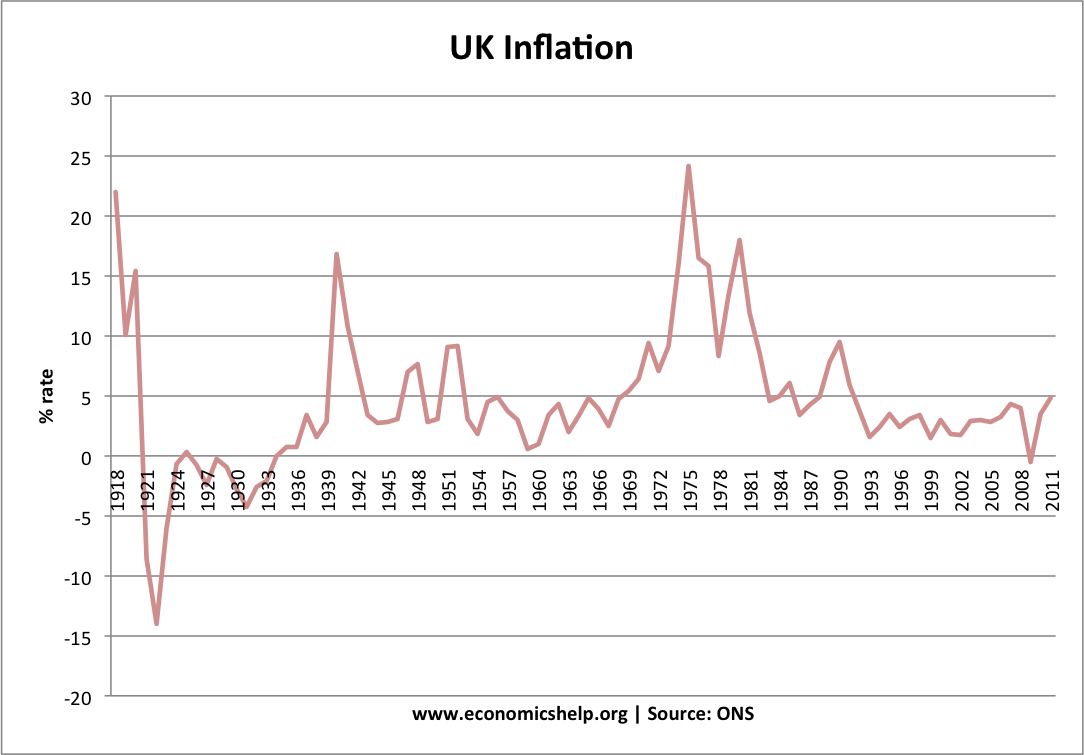
This graph gives a rough guide to inflation in the different recessions.
- Firstly, we have deflation during the 1930-32 recession.
- In 1973-76 recession, there is a significant problem of cost-push inflation contributing to the recession.
- The 1981 recession was partly as a result of attempts to reduce the inflation rate.
- The 1990 recession followed a boom and rise in inflation
- In 2008-12 recession again we had some cost-push inflation meaning inflation was often higher than we might have expected given fall in GDP.
Current account deficits in different recessions
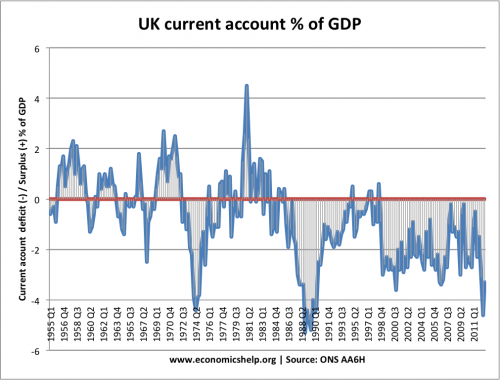
- Post 1974, the current account moves from large deficit to small surplus.
- In 1981 recession, we see one of biggest current account surpluses in this period (caused by falling domestic demand, and strong value of Pound)
- The late 1980s sees a record current account deficit. The recession 1991-1992 reduces this deficit
- The recession of 2008-12, sees little improvement in the overall current account deficit.
Source of data:
Related

4 thoughts on “Comparing different recessions”
Comments are closed.