Economic growth measures the change in real GDP (national income adjusted for inflation; ONS call it chained volume measure of GDP)
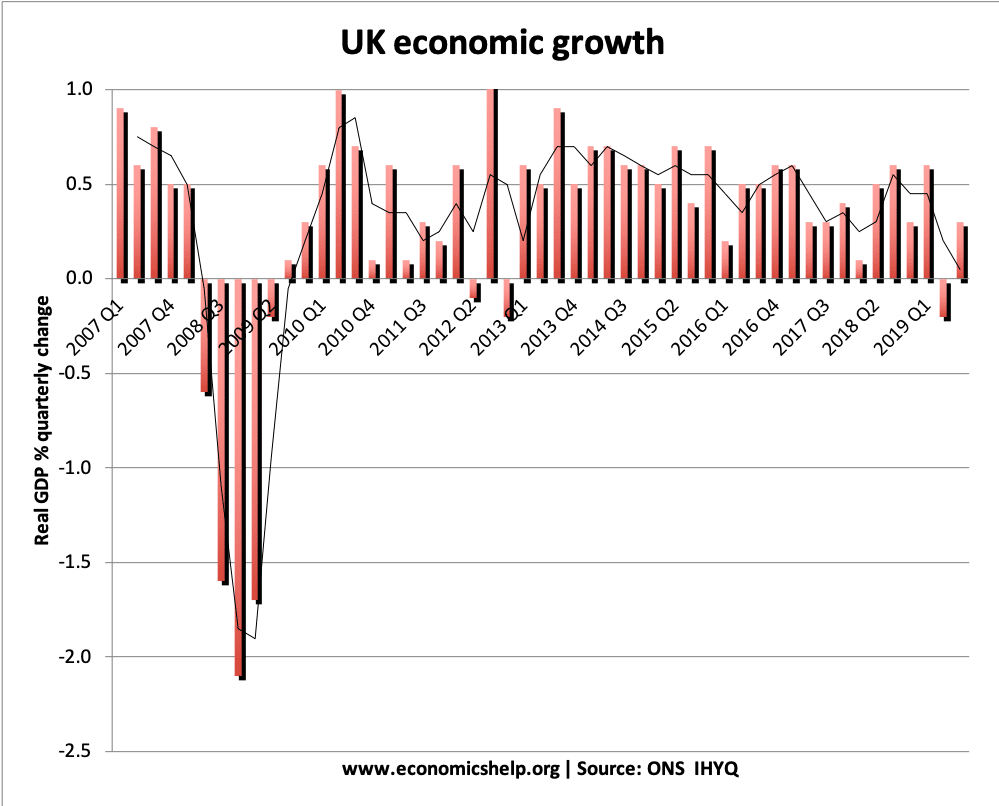
Since the end of the great recession (2008 – 2009) the UK economy has grown in fits and starts. It has been a relatively weak economic recovery compared to previous recessions.
2019 has seen a further slowdown in growth with rolling three-month growth flat at 0.0%.
Economic growth in 2018 – 1.4%
Economic growth in first 3 quarters of 2019 – 0.7%
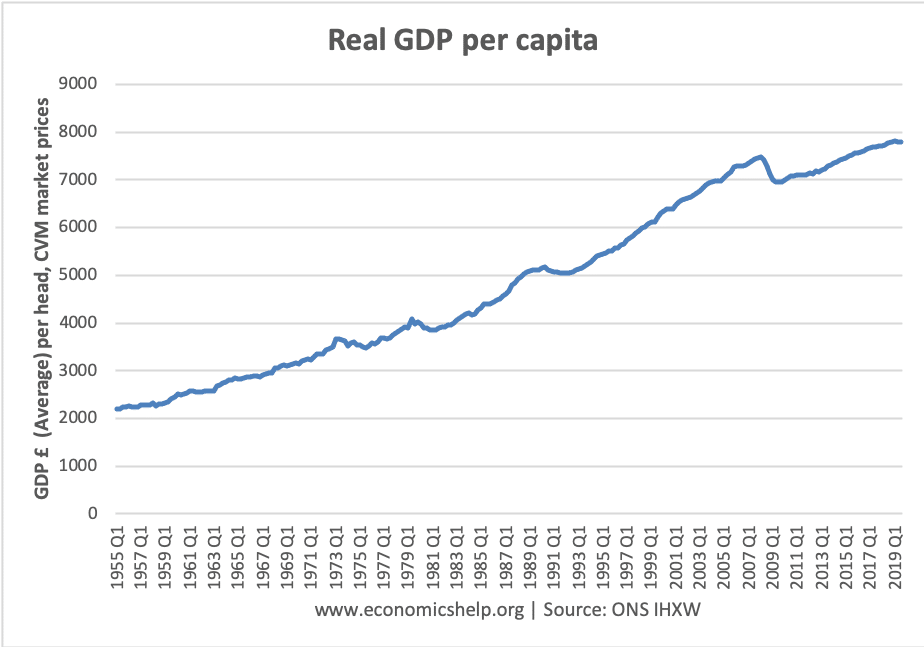
With population growth averaging around 0.6 – 0.8% a year (about 50% of population growth is caused by net migration), real GDP is boosted by this growth in population. Real GDP per capita and average incomes are growing at a slower rate
Since the recession of 1992 ended, the UK experienced a long period of economic growth – it was the longest period of economic growth on expansion. Also, the growth avoided the inflationary booms of the previous decades. However, the credit crunch of 2007-08 hit the UK economy hard and caused a steeper drop in real GDP than even the great depression of the 1930s. Helped by a loosening of monetary and fiscal policy, the UK experienced a partial recovery in 2010 and 2011. But, by Q1 2012, the UK was back in recession.
The second double-dip recession was caused by a variety of factors including the European recession, lower confidence caused by austerity measures, continued weakness of bank lending and falling real incomes.
Since the start of 2013, the UK economy has experienced positive economic growth – one of the relatively best performances in Europe. However, real GDP is still fractionally below its pre-crisis peak of 2007.
Faltering recovery? The recovery has been stronger in the service sector than manufacturing and industrial output. There are fears the UK recovery is still unbalanced – relying on consumer spending, service sector and ultra-loose monetary policy.
Also, real wage growth has been weak, due to low wage growth, and spike in inflation due to devaluation.
It is worth bearing in mind that sometimes economic growth statistics get revised at a later stage.
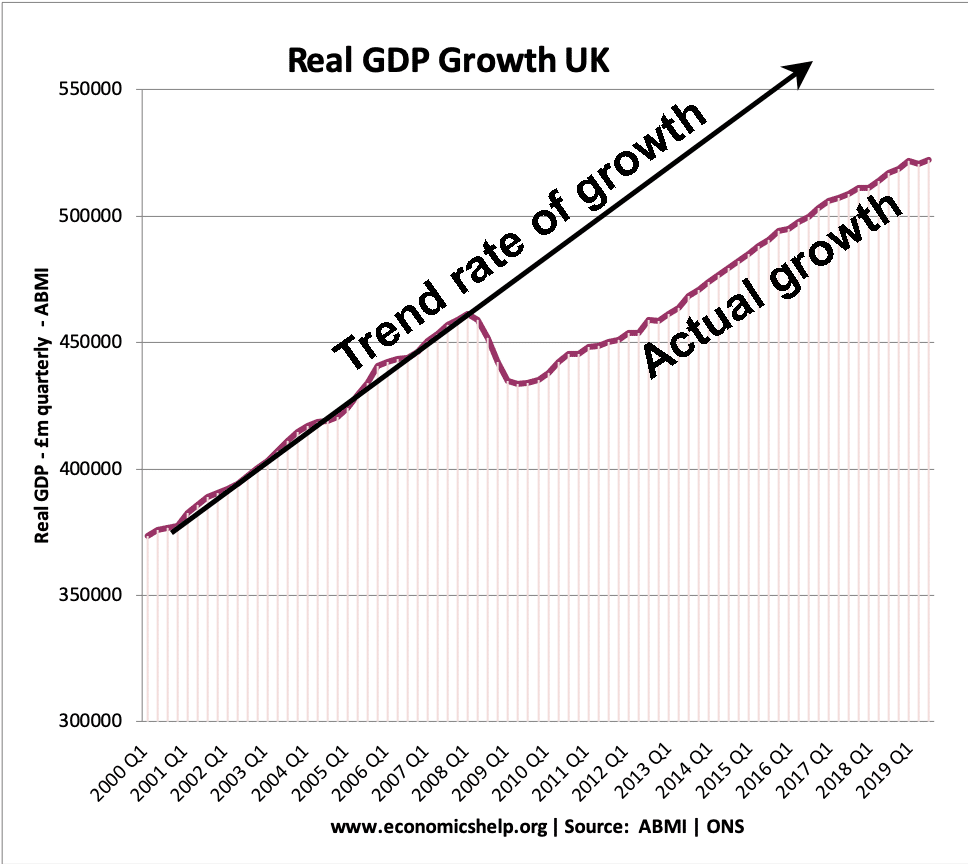
An illustration of how actual GDP has fallen behind the trend growth of GDP, since the start of 2008.
UK GDP since 1955
Usually, the gap between actual growth and the trend rate is an indication of the output gap in an economy. But, given the length and depth of the recession, we have permanently lost some output – The ONS calculates the output gap as quite small.
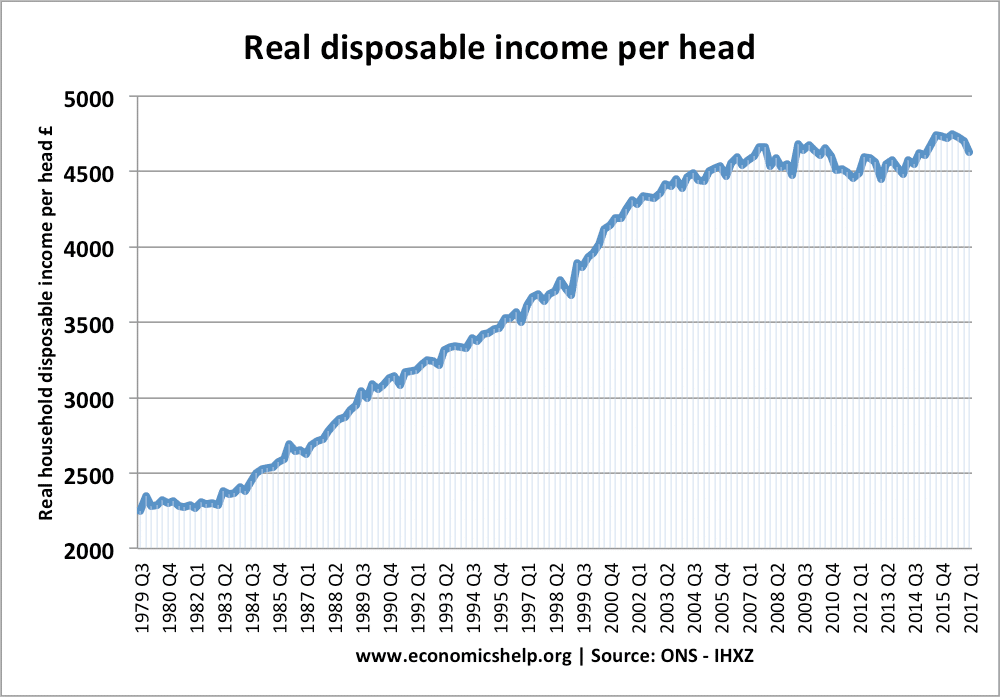
This shows real household disposable income per head. This is an important component of GDP, but GDP is also composed of other income sources, such as profit and dividends. This shows that real household incomes per head have been stagnant since 2007.
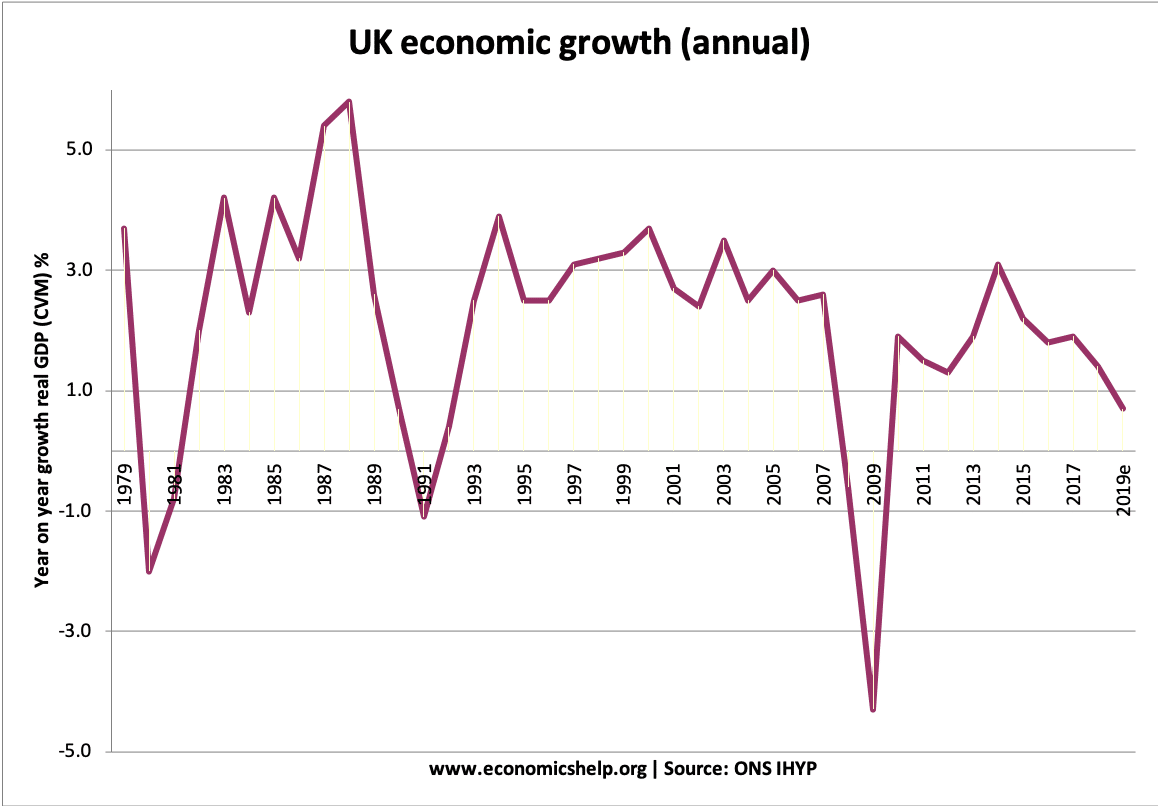
Four Decades of Volatile Growth in the UK
This shows annual growth rates and the recent recessions of 1980-81, 1991, 2008-09
A feature of the UK’s recovery since 2013 has been that unemployment has fallen faster than in previous recession – in the 1980s and 1990s unemployment lagged behind the recovery. This fall in unemployment is due to several factors, such as – more flexible labour markets, low wage growth and low labour productivity. (UK Unemployment mystery)
Hi Tejvan Thanks for the very useful analysis. I was wondering if you have any graphs plotting UK GDP and Unemployment against other economies which have monetary independence and their own currency.
I often see graphs comparing the US with the UK. Are there any which include Sweden, Norway, Switzerland and other countries
This has been really helpful when looking for relevant statistics at the ONS page – I wasn’t sure which dataset to chose and this was really useful. Thanks!


Hi Tejvan
Thanks for the very useful analysis.
I was wondering if you have any graphs plotting UK GDP and Unemployment against other economies which have monetary independence and their own currency.
I often see graphs comparing the US with the UK. Are there any which include Sweden, Norway, Switzerland and other countries
thanks
Jon
Hi there,
This has been really helpful when looking for relevant statistics at the ONS page – I wasn’t sure which dataset to chose and this was really useful. Thanks!