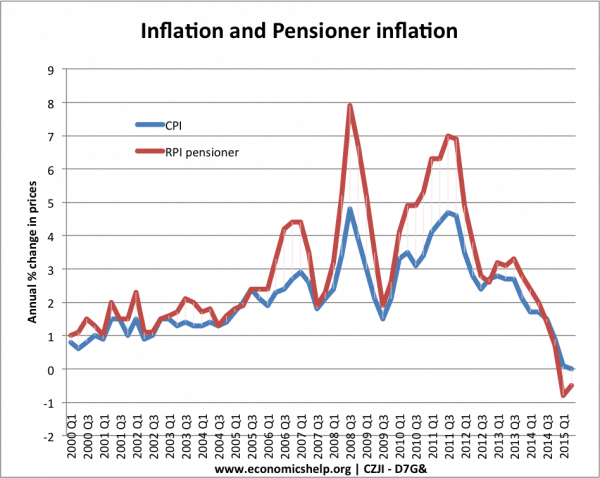
The ONS produce an RPI pensioner index which is the inflation rate calculated for the spending patterns of the average pensioner.
The series is here: RPI Pensioner index
- CZIT – Percentage change over 12 months: One-person pensioner households index.
- CZJI – Percentage change over 12 months – Two-person pensioner households index
Why do pensioners have a different inflation rate to younger people?
- Inflation measures the cost of living. It is calculated by first finding an average basket of goods that people buy.
- The change in prices is then multiplied by the weighting given to different goods – depending on how much the good is purchased.
- The typical basket of goods for pensioners will be different to younger people because of different spending patterns.
Examples of different basket of goods for pensioners vs working age population
- Pensioners are less affected by train and bus fares. Pensioners will not commute and often get subsidised bus fares. Thus, if average rail and bus fares are increasing it will affect younger workers more than pensioners.
- Mortgage payments. Pensioners are more likely to have paid off mortgage – or at least mortgage payments will be a smaller percentage of disposable income. Therefore, increase in interest rates will increase cost of mortgage payments for young people, but pensioners will be less affected.
- Heating – gas and oil. Pensioners are likely to spend a higher percentage of disposable income on gas and electricity. Rising gas and electricity prices will lead to a proportionally bigger increase in the cost of living for pensioners.
- Electronics and takeaway food. Pensioners are less likely to buy computers and other electronic gadgetry. Falling prices of electronic goods will have bigger benefit for younger people than pensioners.
Because of these and other factors – pensioners can face an effective different inflation rate to younger people.

CZJI – is two person pensioner inflation rate – it is similar to one person pensioner inflation rate.
This shows that RPI Pensioner inflation has often been higher than the headline CPI rate. In particular, in 2008 and 2011, pensioners were facing a higher inflation rate. This was primarily due to rising oil, gas and electricity prices – cost push inflation which affected pensioners more.
However, it can work both ways – falling oil and gas prices in 2015 has meant that pensioners are seeing a lower inflation rate than the CPI measure.
RPI and RPI pensioners

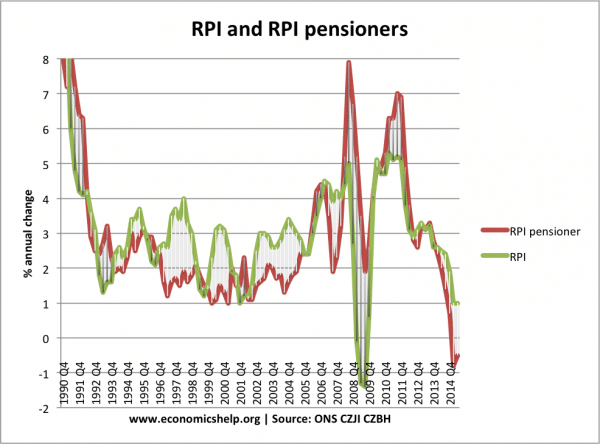
If we compare RPI pensioners with the old measure of inflation RPI (RPI includes mortgage payments and council tax ex. from CPI) Then the situation is different.
From 1996-2005, the Pensioner inflation rate is often lower than RPI. In 2008, there was a very big disparity
- Cut in interest rates, reduced mortgage payments and hence RPI – but oil prices rose causing higher RPI inflation.
CPIH
Just to complicate matters, some believe the best inflation method to use would be CPIH – which includes housing costs and is a mixture of CPI and RPI.
The method of inflation is important
It is important for pensioners whether inflation is linked to CPI, RPI or even to RPI pensioner inflation.
Inflation not only barometer of living standards
- It is important to bear in mind that inflation is not the only barometer of living standards. Pensioners who own house outright have significantly lower outgoing than young people renting or paying mortgage.
- Young people have to pay high tuition fees and often have much more debt than older generation, who tend to have more savings.
- Interest rates and performance of stock market may determine income for retired people.
- Low inflation is relatively good for savers (pensioners) and relatively bad for borrowers (young people)
Related

Quite an interesting observation but appears to
miss out on the reason for inflation or deflation
caused by successive government’s allowing the printing of paper money, at the last count some
£375 bn which causes inflation in order to seek a competitive advantage. So we may have lots of money available to us but it is worth less in real terms.
Always interesting how authorities can “interpret” statistics to suit their needs. Whilst they conceed heating costs, the fact that whilst local rates have been caped ,police rates ,parish rates have been lost whilst rising at 3.5 percent over the last 6 years. Seniors pensions have risen but those of us who saved into SERPS have seen no increase in that fund. Pensioners do buy ready meals , they still have to buy clothing, not for fashion for warmth.savings have been frozen with no income coming from earned savings. How do government expect us to trust them when they massage the truth.