The World Bank publishes several measures of global poverty, which measure poverty by different levels of income. The most common is the percentage of the population who live on less than $1.90 a day. This is a measure of absolute poverty.
There are also measures of relative poverty which compare income against the national average.
Poverty headcount ratios
The % of the population making less than a certain income at purchasing power parity (PPP). Two measures include:
- Poverty headcount ratio at $1.90 a day (WB) (% of the population with less than $1.90
- In 2013 11.2% of world population had an income less than $1.90
- Poverty headcount ratio at $5.50 a day (WB) (% of population with less than $5.50)
- In 2013, 48.7% of world population had income less than $5.50
Poverty Gap
This is the mean shortfall in income or consumption from the poverty line of $3.20 a day (counting the nonpoor as having zero shortfall), expressed as a percentage of the poverty line. This measure reflects the depth of poverty as well as its incidence.
Poverty gap at $3.20 a day (2011 PPP) (%) (WB) – In 2013, the poverty gap for the poor is 10.2% less than $3.20.
Relative Poverty measures
The National poverty headcount ratio is the percentage of the population living below the national poverty lines. (WB)
Multi-dimensional poverty index MPI
Multidimensional Poverty Index (MPI) has been published by the UN since 2010. It measures poverty as an acute deprivation of essential aspects of life. It measures three key targets – living standards, education and healthcare.
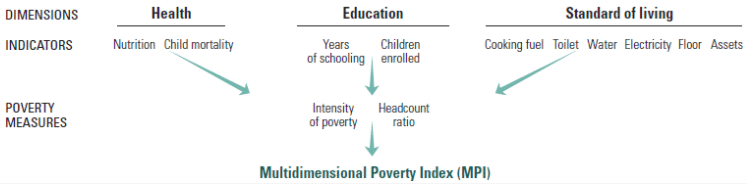
MPI at United Nations
The MPI includes the World Bank headcount ratio, but also factors such as health, education, access to sanitation, water, electricity and the intensity of poverty.
Extreme Global Poverty line of $1.90
- The most common measure of extreme global poverty is the World Bank’s figure of daily income of $1.90.
- The level measures the ratio of the population which live on a daily income of $1.90 or less (measured at purchasing power parity)
- This poverty level was set in 2015 (previously a line of $1 or $1.30 had been used)
- With an income of less than $1.90, it is expected that the individual will struggle to meet basic welfare needs, such as food, shelter, clothing, transport and health care needs.
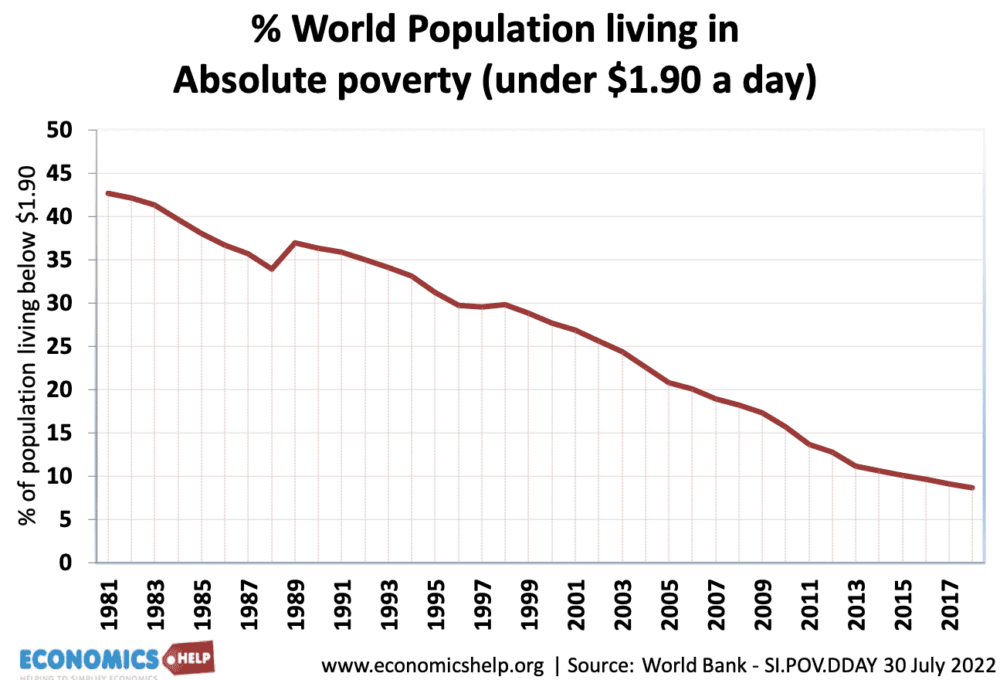
Fall in global poverty
This graph shows that since 1981, the world has seen a decline in the percentage of the world’s population who live under this definition of poverty.
Previous measures of extreme poverty

Source: OurWorldinData.org
Limitations of poverty lines
Intensity of poverty. The poverty line makes no distinction between somebody who earns $1.89 and someone who survives on $0.39. A very low income of less than a $ is much more problematic, but a single poverty line cannot illustrate this difference in the intensity of poverty. The poverty gap measures tries to overcome this by showings how much income is below the poverty line
Income can be hard to measure. In areas of extreme poverty, individuals may be living under conditions of ‘self-sufficiency’ – growing own crops. It is possible someone could have a reasonably good living standard – living off their fields, but it appears a very low monetary income. Equally, somebody may earn $2.00 a day, but find they have to spend a high percentage on housing and food, making it difficult to gain sufficient calories
The link between poverty line and satisfaction

This shows that there is a link between income and dissatisfaction. Low income is associated with greater reports of dissatisfaction. However, amongst countries with very low GDP per capita, there is a big divergence in the reported standard of living. Bangladesh has very low income, but comparable levels of satisfaction to rich countries, such as the US, Hong Kong and Ireland.
Which line to use? Using different lines can give different outcomes. Should we measure at $1.90 or $5.50?
Other factors which determine living standards. While income is a convenient tool, many other factors go to measure living standards – including access to education, health care, environmental standards.
Why fall in Global poverty?
The fall in absolute poverty is quite marked in both past 200 years and also in the past 20 years. The main reasons for the fall in global poverty include
- Economic growth – rising real GDP and national income. This leads to higher wages and increased resources for governments to spend
- New technology and rising productivity. Improved technology has increased the productivity of farming and manufacturing enabling higher output and income.
- Growth in trade
- Growth in Asia. The fall in global poverty is not equally spread out across the world. The biggest falls have been in China, the Indian sub-continent and Asia. Poverty levels in Sub-Saharan Africa have remained stubbornly high.
- This shows Poverty levels in countries with the highest level of poverty, measured by World Bank method of less than $1.90
Poverty headcount ratio at $1.90 a day (2011 PPP) (% of the population)

Related