The highest rates of obesity in the world are found in the small pacific islands, Nauru, Cook Islands with close to 60% of the adult population meeting definition of obesity as measured by the BMI (body mass index)
Excluding these small pacific islands (with very small population) the greatest levels of obesity are found in the Gulf states (Kuwait 37.9%)) and the United States (36.2%) Obesity rates across the world have been increasing in recent decades.
In 2014, more than half the world’s obese people lived in ten countries including United States, China, India, Russia, Brazil, Mexico, Egypt, Germany, Pakistan and Indonesia.
Highest rates of obesity in the world – top 25
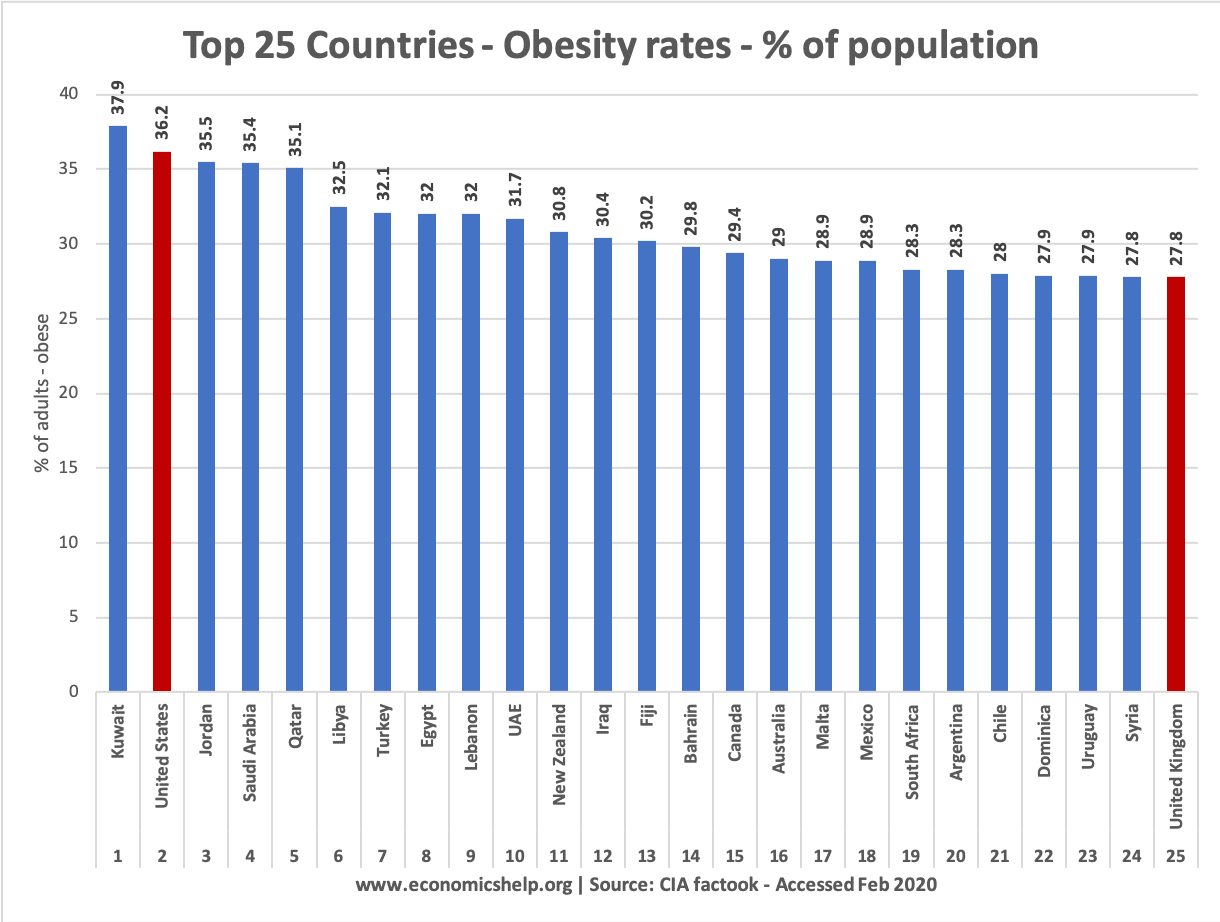
For this list, I excluded small islands, like Nauru and the Cook Islands.
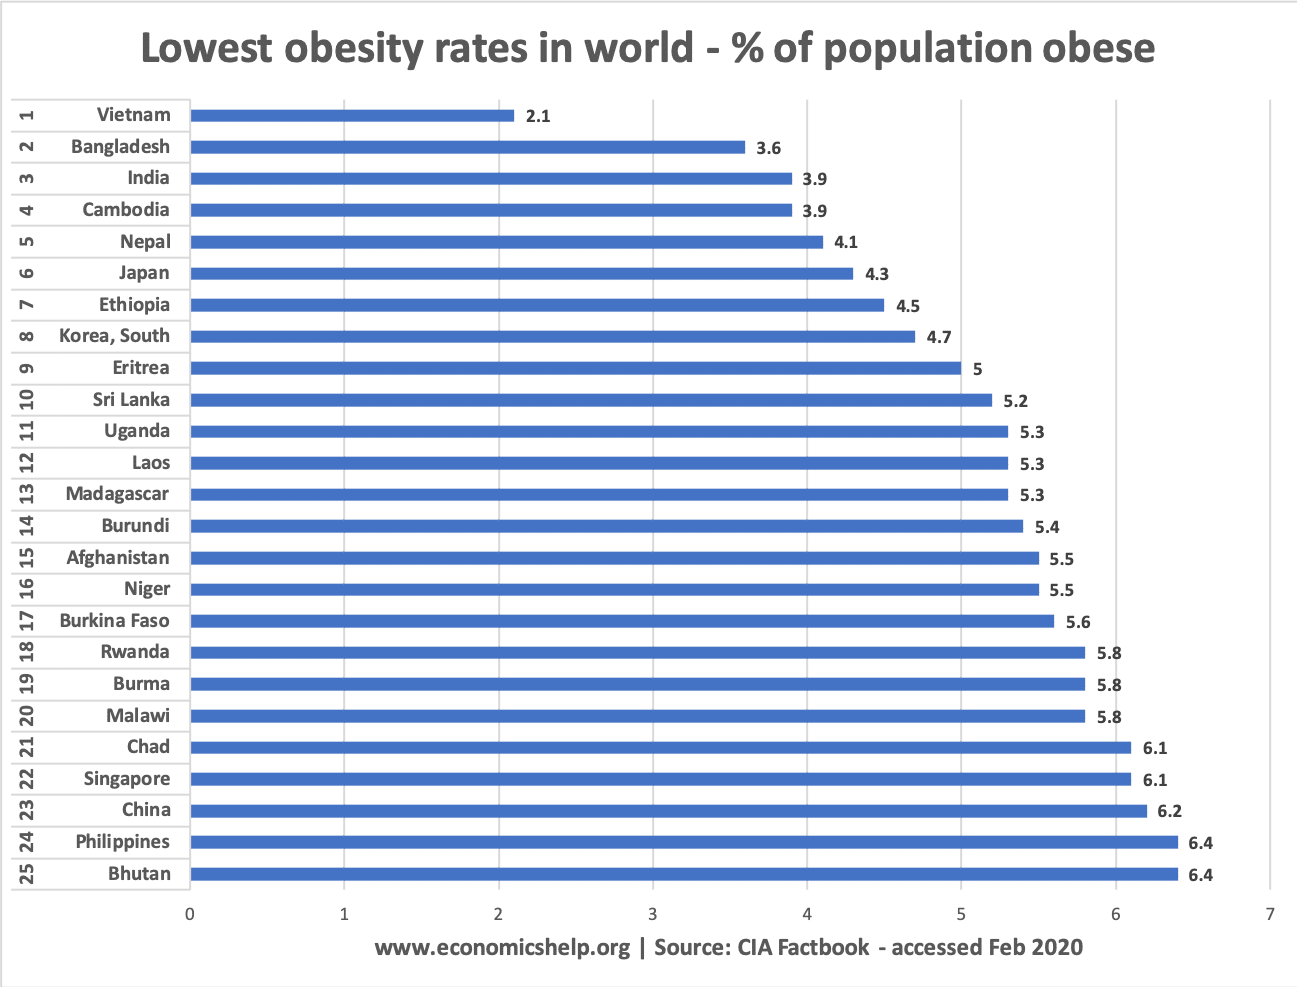
Lowest levels of obesity
Reasons for Obesity
- Income – to some extent higher levels of GDP and national income are related to higher levels of obesity. The lowest levels of obesity are found in developing countries with low real GDP. However, there is not a direct link between income and obesity. Obesity levels are higher in North Africa and the Middle East (Syria, Iraq and Bahrain) than in western economies such as Scandanavia. Moving from very low real GDP to medium levels of GDP can cause a significant increase in obesity. However, there are also notable exceptions with high-income countries, such as Japan experiencing very low levels of obesity (just 4.3%)
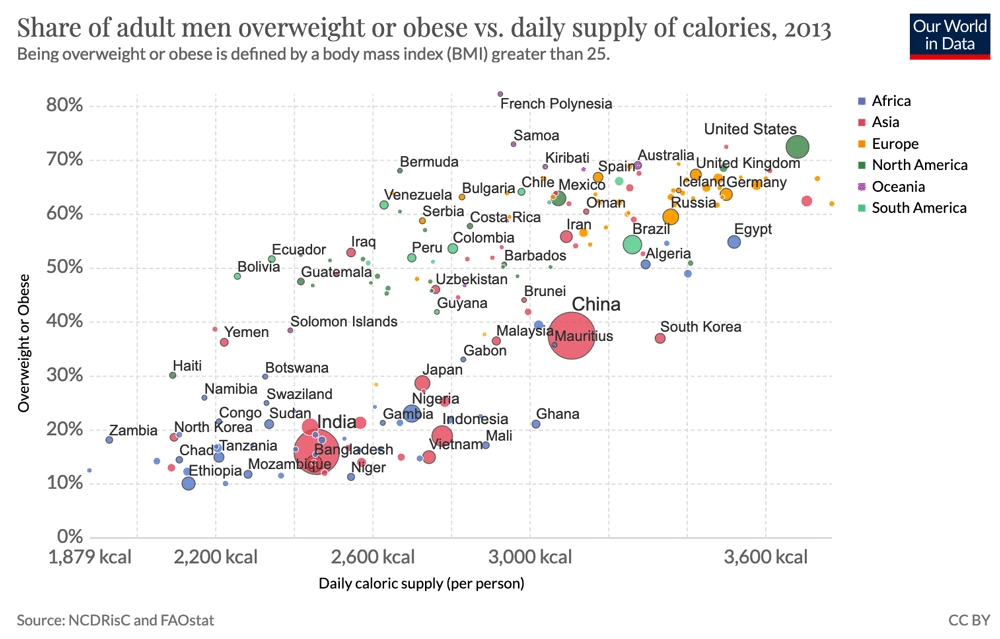
- Consumption of calories. There is a definite link between diet and the number of calories consumed and rates of obesity. In recent years, diets have become richer in calories, through the consumption of more meat, diary, fat-rich food and processed drinks/foods with high levels of added sugar. The Gulf states – one of the highest levels of obesity in the world has seen a 97% increase in meat consumption between 1973 and 2014. Latin America has experienced dramatic growth in obesity levels in the past few decades. There is a strong link with the consumption of high calory soft drinks.
The link between calory consumption and obesity
- Cultural factors. There are regional effects for levels of obesity. The cluster of high levels of obesity in the Pacific Islands is related to cultural trends in food and exercise. High levels of obesity in the gulf states are partly related to lack of exercise and the dramatic growth in high calorie fast-food outlets. (Obesity in Gulf States) Another factor is societies attitude to obesity. In some gulf states and north African countries, being fat can be seen an indicator of wealth and status so it is not necessarily viewed in a negative light as might in say Japan.
- Obesity by gender
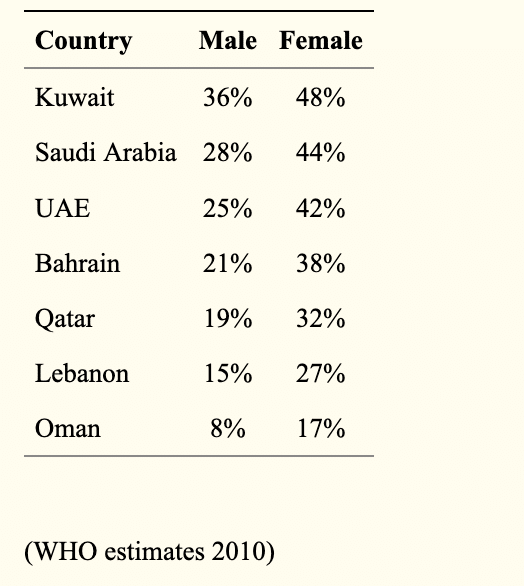
In the gulf states, obesity levels are significantly higher amongst women – which could be related to different lifestyles and lower likelihood of being involved in exercise.
- Modern lifestyles/lack of exercise. Obesity levels are often higher in urban areas than in agricultural areas. For example, in Saudi Arabia, obesity rates among children in rural areas are 4% – this contrasts with 22% in the capital Riyadh. This is related to the fact modern life promotes a sedentary lifestyle – with children using the car for transport. In rural agricultural areas, children are more active as they are involved in helping fishing/farming. (Pub Med)
- The link with education. One study suggested education can have a link to obesity. In Syria, 51% of illiterate Syrians are obese while only 28% of people with a university education are obese. This could reflect the importance of knowing which foods and lifestyle can contribute to obesity.
- Promotion of fast-food/soft-drinks. Latin American countries, in particular, have seen a strong correlation between the rapid growth of sugary soft-drinks and growing levels of obesity. Numerous studies have shown a direct link. For example
“Soft drink consumption increased globally from 9.5 gallons per person per year in 1997 to 11.4 gallons in 2010. A 1% rise in soft drink consumption was associated with an additional 4.8 overweight adults per 100.” 10.2105/AJPH.2012.300974
Growth of obesity in recent years
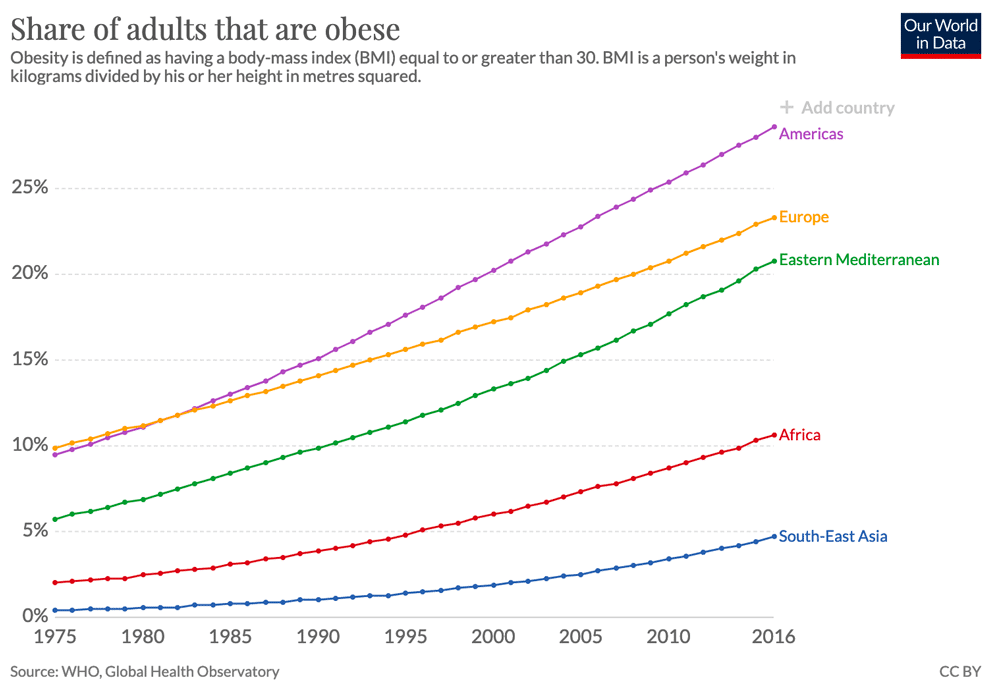 Source: Our World in Data
List of Obesity rates worldwide
| Rank | Country | (%) |
| 1 | Nauru | 61 |
| 2 | Cook Islands | 55.9 |
| 3 | Palau | 55.3 |
| 4 | Marshall Islands | 52.9 |
| 5 | Tuvalu | 51.6 |
| 6 | Niue | 50 |
| 7 | Tonga | 48.2 |
| 8 | Samoa | 47.3 |
| 9 | Kiribati | 46 |
| 10 | Micronesia | 45.8 |
| 11 | Kuwait | 37.9 |
| 12 | United States | 36.2 |
| 13 | Jordan | 35.5 |
| 14 | Saudi Arabia | 35.4 |
| 15 | Qatar | 35.1 |
| 16 | Libya | 32.5 |
| 17 | Turkey | 32.1 |
| 18 | Egypt | 32 |
| 19 | Lebanon | 32 |
| 20 | United Arab Emirates | 31.7 |
| 21 | Bahamas, The | 31.6 |
| 22 | New Zealand | 30.8 |
| 23 | Iraq | 30.4 |
| 24 | Fiji | 30.2 |
| 25 | Bahrain | 29.8 |
| 26 | Canada | 29.4 |
| 27 | Australia | 29 |
| 28 | Malta | 28.9 |
| 29 | Mexico | 28.9 |
| 30 | South Africa | 28.3 |
| 31 | Argentina | 28.3 |
| 32 | Chile | 28 |
| 33 | Dominica | 27.9 |
| 34 | Uruguay | 27.9 |
| 35 | Syria | 27.8 |
| 36 | United Kingdom | 27.8 |
| 37 | Dominican Republic | 27.6 |
| 38 | Algeria | 27.4 |
| 39 | Oman | 27 |
| 40 | Tunisia | 26.9 |
| 41 | Suriname | 26.4 |
| 42 | Hungary | 26.4 |
| 43 | Lithuania | 26.3 |
| 44 | Morocco | 26.1 |
| 45 | Israel | 26.1 |
| 46 | Czechia | 26 |
| 47 | Iran | 25.8 |
| 48 | Costa Rica | 25.7 |
| 49 | Andorra | 25.6 |
| 50 | Venezuela | 25.6 |
| 51 | Ireland | 25.3 |
| 52 | Vanuatu | 25.2 |
| 53 | Bulgaria | 25 |
| 54 | Greece | 24.9 |
| 55 | Jamaica | 24.7 |
| 56 | Cuba | 24.6 |
| 57 | El Salvador | 24.6 |
| 58 | Belarus | 24.5 |
| 59 | Croatia | 24.4 |
| 60 | Belize | 24.1 |
| 61 | Ukraine | 24.1 |
| 62 | Spain | 23.8 |
| 63 | Nicaragua | 23.7 |
| 64 | Saint Vincent | 23.7 |
| 65 | Latvia | 23.6 |
| 66 | Montenegro | 23.3 |
| 67 | Norway | 23.1 |
| 68 | Barbados | 23.1 |
| 69 | Poland | 23.1 |
| 70 | Russia | 23.1 |
| 71 | Saint Kitts and Nevis | 22.9 |
| 72 | Panama | 22.7 |
| 73 | Haiti | 22.7 |
| 74 | Luxembourg | 22.6 |
| 75 | Solomon Islands | 22.5 |
| 76 | Romania | 22.5 |
| 77 | Macedonia | 22.4 |
| 78 | Colombia | 22.3 |
| 79 | Germany | 22.3 |
| 80 | Finland | 22.2 |
| 81 | Belgium | 22.1 |
| 82 | Brazil | 22.1 |
| 83 | Iceland | 21.9 |
| 84 | Cyprus | 21.8 |
| 85 | Albania | 21.7 |
| 86 | Georgia | 21.7 |
| 87 | France | 21.6 |
| 88 | Serbia | 21.5 |
| 89 | Honduras | 21.4 |
| 90 | Grenada | 21.3 |
| 91 | Papua New Guinea | 21.3 |
| 92 | Estonia | 21.2 |
| 93 | Guatemala | 21.2 |
| 94 | Kazakhstan | 21 |
| 95 | Portugal | 20.8 |
| 96 | Mongolia | 20.6 |
| 97 | Sweden | 20.6 |
| 98 | Slovakia | 20.5 |
| 99 | Netherlands | 20.4 |
| 100 | Paraguay | 20.3 |
| 101 | Guyana | 20.2 |
| 102 | Slovenia | 20.2 |
| 103 | Armenia | 20.2 |
| 104 | Bolivia | 20.2 |
| 105 | Austria | 20.1 |
| 106 | Azerbaijan | 19.9 |
| 107 | Italy | 19.9 |
| 108 | Ecuador | 19.9 |
| 109 | Peru | 19.7 |
| 110 | Saint Lucia | 19.7 |
| 111 | Denmark | 19.7 |
| 112 | Switzerland | 19.5 |
| 113 | Antigua and Barbuda | 18.9 |
| 114 | Botswana | 18.9 |
| 115 | Moldova | 18.9 |
| 116 | Trinidad and Tobago | 18.6 |
| 117 | Turkmenistan | 18.6 |
| 118 | Bosnia and Herzegovina | 17.9 |
| 119 | Namibia | 17.2 |
| 120 | Yemen | 17.1 |
| 121 | Kyrgyzstan | 16.6 |
| 122 | Lesotho | 16.6 |
| 123 | Uzbekistan | 16.6 |
| 124 | Swaziland | 16.5 |
| 125 | Malaysia | 15.6 |
| 126 | Zimbabwe | 15.5 |
| 127 | Gabon | 15 |
| 128 | Tajikistan | 14.2 |
| 129 | Brunei | 14.1 |
| 130 | Seychelles | 14 |
| 131 | Djibouti | 13.5 |
| 132 | Mauritania | 12.7 |
| 133 | Sao Tome + Principe | 12.4 |
| 134 | Cabo Verde | 11.8 |
| 135 | Cameroon | 11.4 |
| 136 | Ghana | 10.9 |
| 137 | Mauritius | 10.8 |
| 138 | Gambia, The | 10.3 |
| 139 | Cote d’Ivoire | 10.3 |
| 140 | Thailand | 10 |
| 141 | Liberia | 9.9 |
| 142 | Benin | 9.6 |
| 143 | Congo, Republic | 9.6 |
| 144 | Guinea-Bissau | 9.5 |
| 145 | Nigeria | 8.9 |
| 146 | Senegal | 8.8 |
| 147 | Sierra Leone | 8.7 |
| 148 | Maldives | 8.6 |
| 149 | Mali | 8.6 |
| 150 | Pakistan | 8.6 |
| 151 | Togo | 8.4 |
| 152 | Tanzania | 8.4 |
| 153 | Somalia | 8.3 |
| 154 | Angola | 8.2 |
| 155 | Zambia | 8.1 |
| 156 | Equatorial Guinea | 8 |
| 157 | Comoros | 7.8 |
| 158 | Guinea | 7.7 |
| 159 | Central African Republic | 7.5 |
| 160 | Mozambique | 7.2 |
| 161 | Kenya | 7.1 |
| 162 | Indonesia | 6.9 |
| 163 | Korea, North | 6.8 |
| 164 | Congo, Dem. Rep. | 6.7 |
| 165 | Sudan | 6.6 |
| 166 | South Sudan | 6.6 |
| 167 | Bhutan | 6.4 |
| 168 | Philippines | 6.4 |
| 169 | China | 6.2 |
| 170 | Singapore | 6.1 |
| 171 | Chad | 6.1 |
| 172 | Malawi | 5.8 |
| 173 | Burma | 5.8 |
| 174 | Rwanda | 5.8 |
| 175 | Burkina Faso | 5.6 |
| 176 | Niger | 5.5 |
| 177 | Afghanistan | 5.5 |
| 178 | Burundi | 5.4 |
| 179 | Madagascar | 5.3 |
| 180 | Laos | 5.3 |
| 181 | Uganda | 5.3 |
| 182 | Sri Lanka | 5.2 |
| 183 | Eritrea | 5 |
| 184 | Korea, South | 4.7 |
| 185 | Ethiopia | 4.5 |
| 186 | Japan | 4.3 |
| 187 | Nepal | 4.1 |
| 188 | Cambodia | 3.9 |
| 189 | India | 3.9 |
| 190 | Timor-Leste | 3.8 |
| 191 | Bangladesh | 3.6 |
| 192 | Vietnam | 2.1 |
Related posts
what is the obesity rates of the Czech Republic and the Slovak Republic?
also side note if you want your page to look more developed country oriented, then get a chart or something of the OECD list.