GDP measures gross domestic product. It is a measure of a nations economic output/income/expenditure.
GDP is an excellent guide to the total number of marketable goods and services produced and consumed in an economy. It is a useful economic statistic – especially for managing the economic cycle, but has often become a short-hand for economic welfare. However this was never it’s intended role. As Robert Kennedy remarked in 1968 GDP
“measures everything in short, except that which makes life worthwhile”,
GDP can be a misleading guide to living standards as it ignores many important issues, such as the environment, leisure time, non-marketable goods, air quality, inequality, life expectancy, education levels.
GDP can also encourage society to maximise material consumption, which has harmful effects for the environment and quality of life. Alternatives to GDP include (not exhaustive list)
Alternatives to GDP
- Genuine Progress Indicator (GPI)
- Index of Human Development (HDI)
- Human Poverty Index (HPI)
- Gross Domestic Happiness (GDH)
- Index of Sustainable Economic Welfare (ISEW)
- Happy Planet Index – measure of environmental efficiency for supporting well-being
- Green gross domestic product (green GDP or GGDP)
- Median income – (average wages)
- Well-Being index
1. Genuine Progress Indicator (GPI)
The GPI seeks to take a more accurate account of a nation’s well being than just GDP (gross domestic product). GPI starts with GDP as its base but also takes into account environmental and social factors such as
- Pollution
- Poverty rates
- Health standards
- Inequality rates
- Crime rates
- Cost of pollution abatement
- Cost of commuting
- Cost of road accidents
- Value of education
- Value of housework and parenting

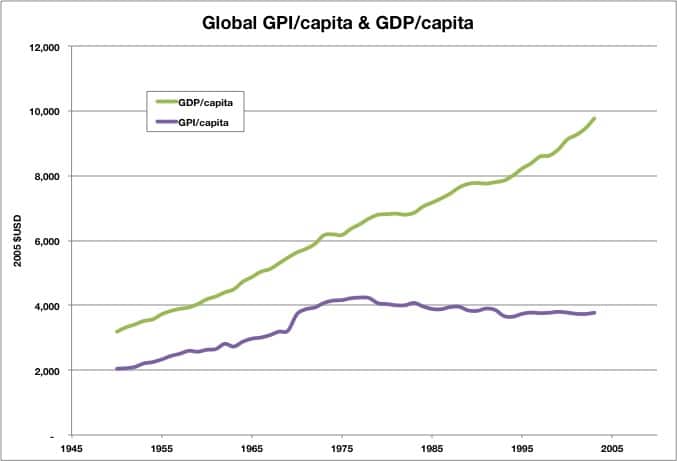
This graph for global GPI, shows it is much harder to increase GPI than GDP. This is because if people spend time sitting in a traffic jam, that increases GDP but not GPI.
More detail on GPI
2. Human Development Index (HDI)
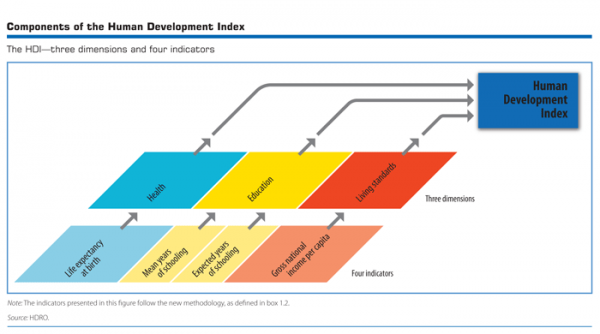
This gives a weighting to national income, life expectancy and quality of education.
- Life Expectancy Index. Average life expectancy compared to a global expected life expectancy.
- Education Index
- mean years of schooling
- expected years of schooling
- Income Index (Gross National Income – GNI at PPP)
Therefore, it is much more than GDP because it looks at education standards, health care and life expectancy.
More on Human Development Index
3. Index of Human Poverty HPI
The human poverty index (HPI) was introduced by UN Development Programme (UNDP)
To measure rates of economic development for low-income countries it examines education, life expectancy, rates of absolute poverty and access to health care and safe drinking water.
(HPI-1) It involves combining:
- Probability at birth of not surviving to age 40 (times 100)
- Adult illiteracy rate
- Arithmetic average of these three characteristics:
- The percentage of the population without access to safe water.
- The percentage of population without access to health services.
- The percentage of malnourished children under five.
4. Gross National Happiness (GNH)
GNH looks at nine different factors including psychological well-being, health, time use, education, cultural diversity and resilience, good governance, community vitality, ecological diversity and resilience, and living standards. The four pillars of GNH are:
- Sustainable and equitable socio-economic development;
- Environmental conservation;
- Preservation and promotion of culture
- Good governance.
It has been adopted by Bhutan since 2008 and is strongly influenced by Buddhist concepts.
5. Index of sustainable economic welfare (ISEW)
Similar to GPI,the ISEW seeks to take into account non-marketable services, e.g. domestic labour and subtract environmental degradation. Defensive expenditures are spending on dealing with problems, e.g. if you consume petrol, but spend time in traffic jam, this defensive spending is removed.
ISEW =
+ personal consumption
+ public non-defensive expenditures
+ capital formation
+ services from domestic labour
– private defensive expenditures
– costs of environmental degradation
– depreciation of natural capital
6. Happy Planet Index (HPI)
This is a measure of human well being adjusted for environmental impact. It looks at life expectancy and life satisfaction divided by the ecological impact of the nation. So if a country has a high carbon footprint, it will, ceteris paribus have a lower HPI score because more resources are needed. A high score would have a high life satisfaction combined with low ecological footprint. The highest-ranking countries are in Central America – Colombia, Costa Rica, Dominica and Panama. The US with high carbon footprint is ranked as one of the lowest.
7. Green GDP
This adjusts GDP for resource depletion and environmental degradation.
In 2004, China experimented with green GDP. But, once pollution and environmental costs were added in it displayed zero growth. It was discarded in 2007.
8. Net National Disposable income (NNDI)
NNDI is net of profit and rents that flow abroad because of firms and assets owned by foreign investors. NNDI adjusts for capital consumption (depreciation on machines, vehicles, infrastructure) GDP is gross it measures spending on overcoming depreciation
9. Median income
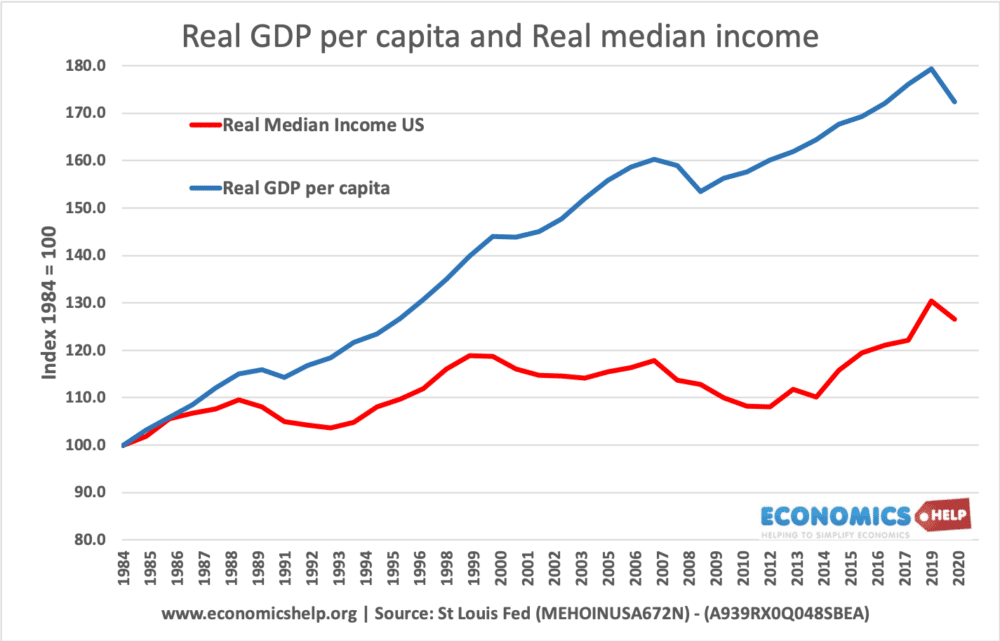
Since the great recession, the US is producing more millionaires and billionaires, but 75% of jobs in US created are only marginally above the minimum wage.

10. Well-Being / Living Standards Framework LSF
The UK has a measure of well-being. In 2019, the New Zealand government submitted a budget based on ‘well-being’ targeting six areas mental health, child well-being, equality of distribution and skills and opportunities.

