
In both 2007 and 1991, house prices fell 20%, will see something similar this year? The really interesting question is whether house prices return to the post-war levels of affordability like after the crashes of 1990 and to a lesser extent 2008.
If house prices were to quickly fall to 3 times earnings, it would require a 50% fall in house prices. If house prices fell to 5 times earnings like 2009, it would require a 23% fall in house prices.

Assuming salaries stay at £39,130, the price drops will be
£270,000 6.9 = £39,130
£207,389 5.0 = £39,130 (-23% fall)
£124,430 3* = £39,130 (-54%)
Though, if salaries rise 6%, then it will be closer to 20% and 50% fall. Another way for house price to income ratios to fall is for house prices to stagnate, but wages to rise. This was a key factor in early 1990s. After initial house price collapse, it took a long time for market to recover. House prices didn’t fall much further, but as wages rose, house price to income ratios continued to decline.

Firstly, what is actually happening to house prices right now? The ONS show house price inflation of 6%. But, the Nationwide stats show annual house price inflation is -3.1% – the biggest annual fall since 2009. And, if we take inflation into account, real house prices have fallen 11% in the past 12 months.

All the different house price indexes – Zoopla, Halifax and Rightmove are giving different inflation rates. It is hard to predict the housing market when the current situation is murky itself. Later in the video, I’ll explain the different house price stats but first, will we see a 1990s style correction?
After the 1991 crash, house price-to-income ratios did fall back to 3 times income – a common ratio for the post-war period. You could say this is the golden ratio of house prices because it means the average person on the average salary can afford to buy a house. It is the great British Dream – own a house. Not too much to ask for -or is it?
If house prices did return to this post-war level of affordability, we would be looking at a pretty major crash in house prices. But as much as I would like houses to become really affordable for everyone, I can’t see this happening for four reasons.

Firstly, in the post-war period, it was more common for a household to have one major earner. Currently, if you earn £35,000, then the most you could borrow from a lender is £100,000. But a couple with a total of £70,000, then the amount you can borrow rises to £200,000. Just enough to buy a house in some of the cheapest areas of the country. But, the rise in dual-income households has changed the housing affordability criteria. It is bad news for the increasing number of single people – in fact, it has spawned a new range of joint mortgages for people in exactly that situation. But, the key thing is long-term affordability has been pushed up by the fact more households now have multiple earners, driven by a rise in working mothers.

Secondly, despite the recent significant rise in interest rates, I still expect long-term interest rates to be lower than in the post-war period. This century, long-term interest rates have been declining. In fact, they have been consistently declining since the fourteenth century. With an ageing population and slower economic growth, rates are unlikely to return to a post-war average of 7-10%. In Japan, the first country to see an ageing population, interest rates have been stuck close to zero for decades. That could be Europe’s future soon.

Nevertheless that is the long-term. In the short-term, the significant rise in mortgage rates is the principal cause of the correction in house prices. The market got used to very low rates, now they have increased – mortgage affordability rates have declined, encouraging landlords to sell and making it hard for first-time buyers. The IMF state that as a very rough rule of thumb for every 1% rise in base rates, house prices fall 2%. This explains the logic of why a rise in rates to 4-5%, has caused the OBR to predict a 10% fall in house prices. I actually believe this rule of thumb to be on the conservative side. Because house prices are currently so expensive and mortgages so big, that a rise in interest rates has much more effect on affordability than it did in the early 1990s. The relatively small rise in interest rates has seen first-time buyers see mortgage payments as a share of income soars to levels last seen in 1991 and 2007.

Last Autumn under the crazy economic experiment of Truss and Kwarteng, mortgage rates were soaring to over 6%. Under that climate, a much bigger house price fall was predicted. But, since their departure, the mortgage market has somewhat stabilised. Nevertheless, it is a mistake to think everything is back to normal already. Interest rates tend to have a significant time lag. Increasing numbers of people will be facing higher rates in the next coming months. We still haven’t seen the full impact of higher rates from last year. On top of that, cost of living pressures and falling real wages will further depress demand – even though renters would try do anything to escape a crazy rental market. However, the removal of help to buy is another factor which will limit demand.
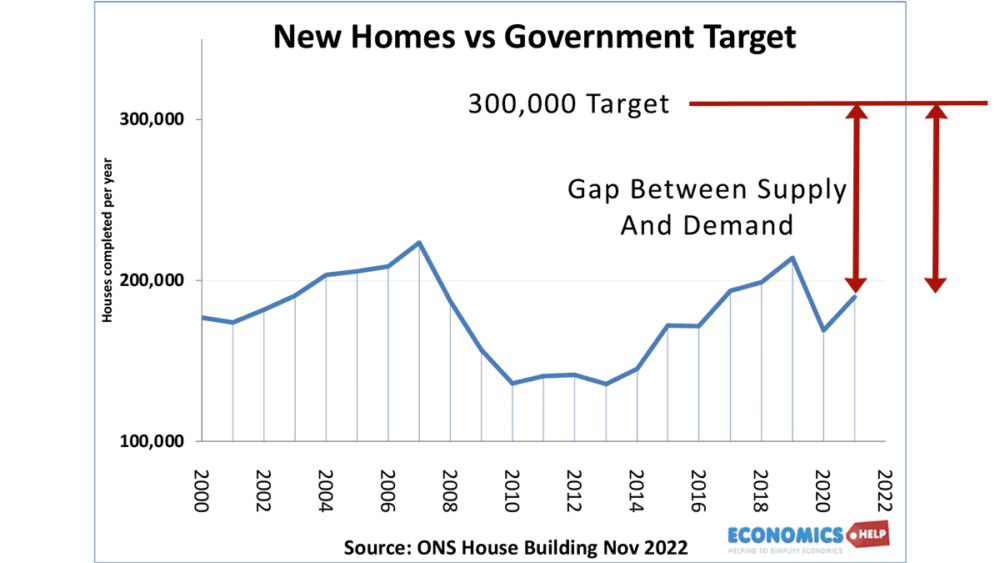
Another factor impacting long-term affordability trends is the supply of housing. The UK has one of the highest occupancy rates in Europe. A lack of building has led to suppressed household formation of around 1.6 million. The best example is more young adults living with parents trying to save a deposit. Unfortunately, the news on house building is not great. Approvals have fallen to their lowest rate as governments are caught between their promises to build more houses and the political pressures not to build houses. It is a topic I went into more detail in the broken UK Housing market.
Another factor underpinning high house prices is wealth, and gifts from parents. It is a reason why some are able to put down large deposits, reducing the impact of mortgage multiples. Also, the UK has been a magnet for overseas investors buying property – something that has become more desirable after the devaluation of the Pound.
Another interesting issue for the UK housing market is the state of the banking sector. In 2007, a major cause of the housing crash was the global credit crunch which caused mortgage lenders to pull back on lending. This was as important as the rise in interest rates. Compared to 2007, the banking sector is less exposed to risk. However, the recent collapse of major US banks and jitters in the European market shows that nothing can be taken for granted. The problem with credit crunches is that it is easy to miss them until they unexpectedly hit with ferocity.

When talking about house prices, we nearly always deal in nominal prices. However, when talking about GDP, incomes and output, we always look at real GDP – we take into account inflation – So when we have inflation of 10%, but house prices stay the same in nominal terms, the real inflation-adjusted price is actually falling 10%. During periods of high inflation, we tend to see rising wages, which in theory should make housing much more affordable. Although of course, this is complicated by the fact wages are not actually keeping up with inflation. Given the pressures facing the housing market, we could easily have a real house fall in house prices of 20-25%, but the headline nominal figure may be much less noticeable around 10%. For example, in 1974-75 interest rates rose to 15%. Combined with a deep recession, it was the classic ingredient for a house price crash, except prices continued to rise. However, if we take into account the very high inflation of the 1970s, real prices fell 25%. It was the house price crash, that wasn’t noticed.
Personally, I believe real house prices are a better guide to the state of the housing market. But, when it comes to housing, it’s much easier to deal in nominal figures.

Why is there different and often conflicting data on the housing market? The Halifax and Nationwide produce house price data based on their mortgage lending. Therefore their data tends to reflect recent changes in the housing market. The ONS house price index uses a different method. It uses land registry details at the registration of sale. The result is that it has a time delay compared to mortgage indexes. Rightmove uses the asking price used at the time the property is put on the website. This ignores discounts on the asking price and may reflect past sentiments of what prices are worth. For example, Zoopla state that the average discount on prices is now running at 4.5% the highest for 5 years – which suggests a buyers’ market and downward pressure on prices. Also, spring is traditionally the busiest time for buying a house. Seasonally adjusted prices may be weaker than current figures suggest.
What about the difference between say Nationwide and Halifax? There is always some monthly noise. Usually, they move close together but when the market changes, they are more likely to be out of step. Traditionally, Nationwide was more weighted to south and Halifax to north. I’m not sure how true this still is. But, certainly the South is more vulnerable to rising interest rates.
My favourite house price index is nationwide. Simply because the data is the most accessible, and comprehensive and it goes all the way back to 1955. They also produce figures for real house prices which is useful.
Anyway, to answer the question – I think the house price correction of 2023 and 2024 will be less steep than in 1991 and 2008. This is partly due to high inflation. But, also despite the downward pressure of higher rates, there are factors pushing up long-term affordability. In nominal terms, you might see falls of 10-15%. Bigger in real terms. Of course, it could be worse if we have an unexpected credit crunch or renewed inflationary surge, but at the moment this is unlikely.
Further reading