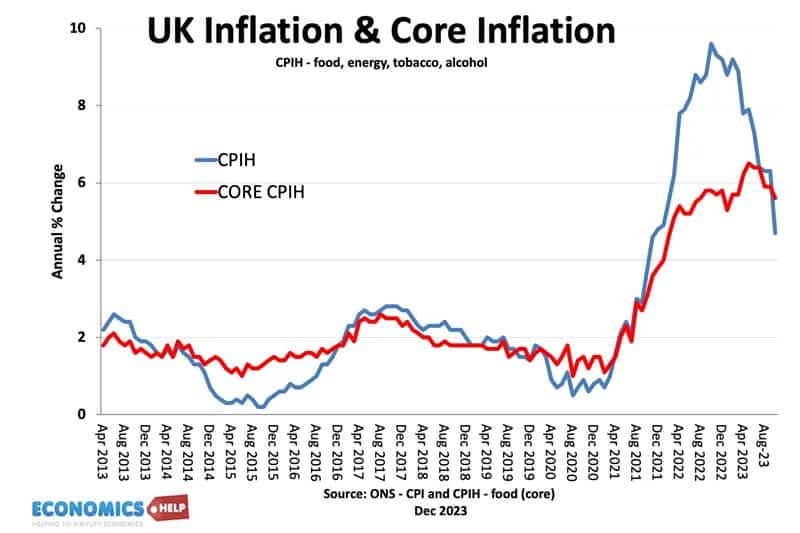
In the past few months, inflation in the UK has halved from 10 to 4.7%. In the US it has fallen to 3% but ask an average shopper and they may express scepticism, the cost of living seems to be rising much faster.
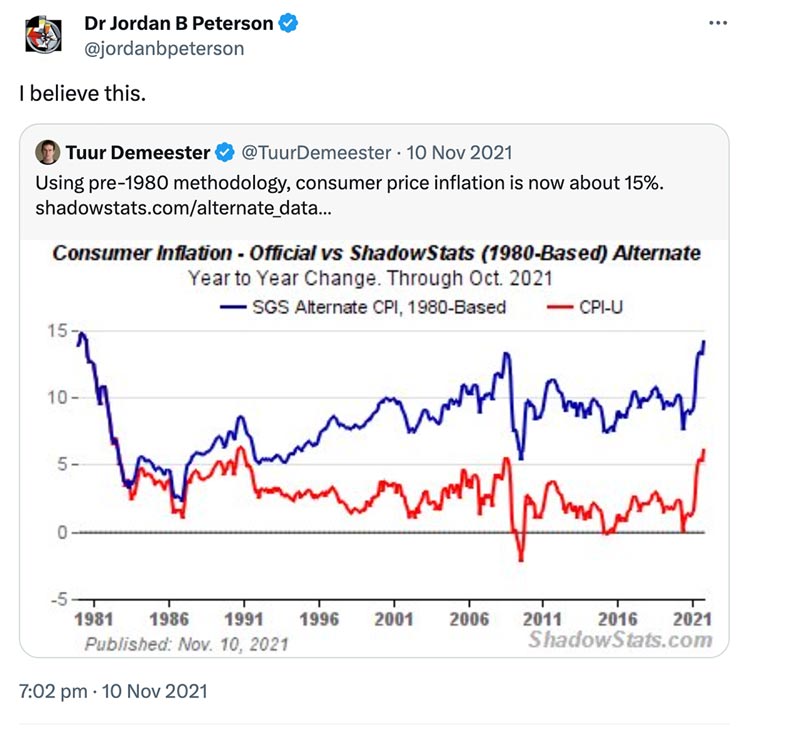
In 2021 Jordan Peterson tweeted that he believes inflation was 15% rather than the official level of 6%. And he’s not alone, surveys suggest nearly a third of Americans don’t trust inflation data. Why do some pundits believe inflation is actually higher and are these analysis correct?
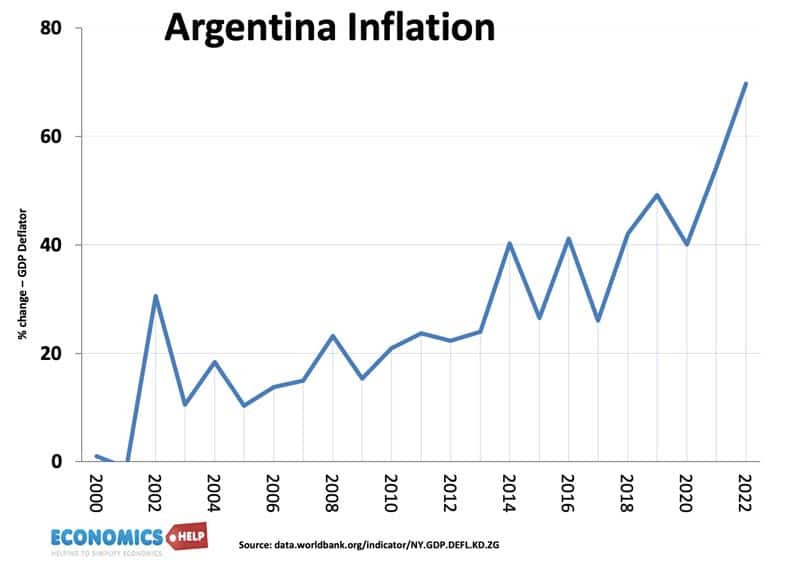
Firstly, governments can intervene in inflation data. In the early 2000s, Argentina had a bout of 40% inflation. To fix it, they introduced price controls. The problem is they didn’t work and inflation remained perilously high. The government’s response to high inflation was to fire the statisticians in charge and produced their own statistics, which miraculously showed lower inflation. For a time, it became illegal in Argentina to publish inflation data which conflicted with government data. However, no one was fooled. Certainly not Argentinian citizens who had to pay for the higher prices. Also, private economists developed alternative models, for example, implying inflation from the fall in exchange rate. Others such as the billion price index measured online prices.
Why People don’t believe?
The UK and US have independent statistics agencies, and here the claims are different. Why are people likely to believe inflation is higher than official. Firstly, in 2021, we had prices rising faster than wages. It was an unexpected fall in real incomes, so we notice price rises much more. But where did that claim of 15% inflation come from? In the 1980s, the US changed its methodology of calculating inflation, the ONS made similar changes in the UK. John Williams who runs Shadowstats claims that if we used the old methodology of calculating inflation, the real inflation rate is much higher than the official CPI measure.
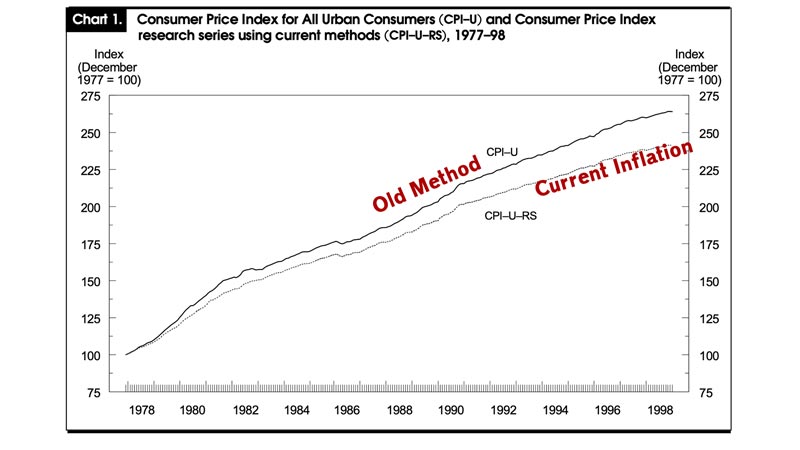
Now The Bureau of Labour did produce a report saying that if they used old measures of calculating inflation, the official figure would be higher 5% over 20 years, but only by 0.45% per year. Nothing like the 5-6% higher per year that Shadowstat claims.
Changes to calculating inflation
Why did they change the way they calculate inflation? There were many small changes, but to give one example. If we take a tv? We are constantly measuring a different product. In 1980 the average tv was small screen, low-res, black and white, and might take a few minutes to warm up. A TV we buy in 2023, is more expensive, but it is almost a different product. 4k, 48 inch flatscreen e.t.c. Therefore, if tv’s increase in price, we have to adjust for the fact, that it is also higher quality, almost a different product. So when measuring price changes, we have to adjust for quality change too. My first mobile phone I bought in 2000, a Nokia cost £40. My last mobile phone an iPhone 14 cost £500, but we don’t say that is inflation 1000% . Buying an iPhone means I don’t need to buy a camera, video recorder, calculator, alarm clock, e.t.c. Inflation measures the cost of living, but if a more expensive iPhone means we don’t need to buy a camera and film, this has to be taken into account.
The problem with Shadowstats is that they are not actually calculating using old methodology, which would be incredibly difficult. They are just using a fudge factor, which pushes up inflation by 5-6%. It is also a basic mathematical mistake. They took the 5.5% change over 20 years and converted it to 5.5% per year. According to shadowstats it would mean an average inflation rate of 9% since 2000, and prices should have risen six-fold. Has anything increased 600% since 2000?
Psychological reasons
Nevertheless, the fact people consider inflation to be higher than official figures is still very interesting, and I can sympathise with it to some extent. Last August, I went to New York, and a big topic of conversation was inflation. Why because it seemed like everything had doubled in price since the last time I was there. I go for breakfast in a New York diner. Pre-pandemic, I could get breakfast with a $10 bill. Now I need a $20 bill. I remember discussing the surging cost of food, and at one point in the conversation, I wondered shall I mention the Federal Reserve’s preferred method of inflation the personal consumption expenditures price index (PCE)is currently 2.5%. I thought about saying this but thought better of it, and joined in the general complaint about how high inflation is.
12 months vs people’s memories
There’s an important thing to be aware of. CPI measures inflation over the past 12 months. But, as individuals we measure inflation over a longer time period than official stats. We tend to remember prices from 2-3 years ago. Therefore, it is understandable we don’t place too much emphasis on an official inflation figure of 2.5%, when we can’t afford to eat out. An interesting observation is that in America, people are pessimistic about the economy, despite theoretically good economic data – low inflation, high growth, high employment. Partly it is partisan and negative media coverage – Republicans are more likely to believe the economy is doing very badly. But, also because prices are still significantly higher than 2-3 years ago. And it was a real psychological shock to have a burst of inflation after decades of low inflation.
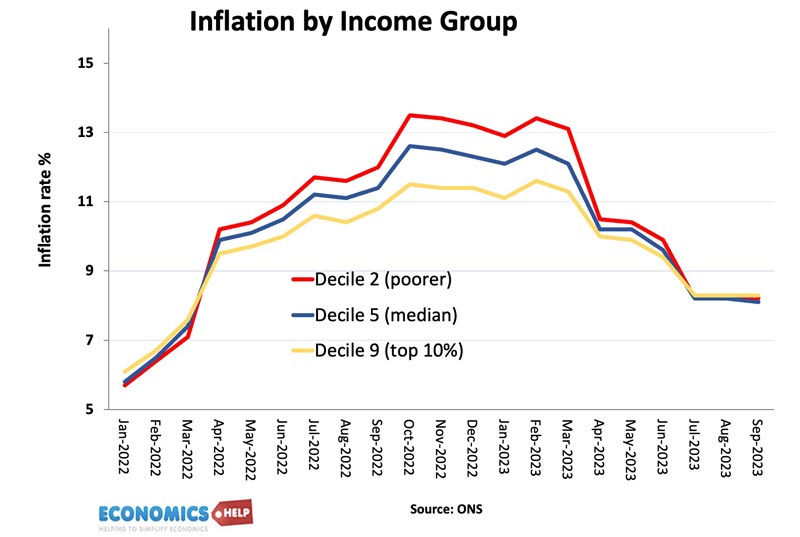
Another example of why people can feel inflation is higher is that your personal inflation rate can literally be higher. For example, the poorest groups in society will tend to pay a higher percentage of their income on basic necessities such as food and energy, and a smaller share on luxury goods like electronics. In 2022, we saw food inflation running at 20% and energy inflation touching 50%. Therefore, the poorest groups in society were experiencing a higher rate of inflation than the average for the economy. This is confirmed by ONS data which shows the poorest were facing higher inflation than the richest. This matters a lot because benefits are linked to the official measure of inflation. So benefits may rise by 10%, but the effective inflation rate for these benefit holders was 15%. So when groups of people may feel inflation is higher than the official figure, this is one real explanation. At the moment, it is householders who are experiencing higher inflation rates. Due to rising interest rates, those with mortgages are seeing a significant rise in their owner occupying costs. Ironic that using higher interest rates to reduce inflation causes some inflation itself.
Different methods
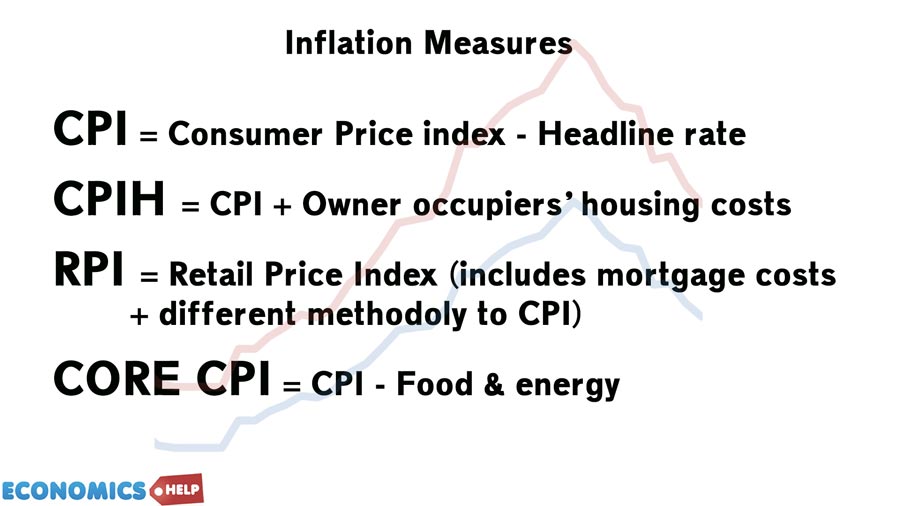
Another complicated factor in measuring inflation is that there are many different ways to do it. The UK alone has many official methods, CPI, CPIH, RPI. If it sounds confusing, don’t worry you’re in good company. To simplify all these methods, we can concentrate on two – the headline rate which measures all the major prices in the economy and the underlying or core inflation rate, which excludes volatile items like food and energy.

For example, in the UK, headline inflation rose to 11%, due to volatile factors like higher oil prices but underlying inflation was not quite as bad. Now with lower oil prices, the headline rate has fallen to 4.7%, but the underlying inflation pressures are still there. This is why you have to be careful of placing too much emphasis on the headline measure. Services inflation is running close to 7%, a reflection of higher nominal wages, and this will concern the Bank of England because it will be hard to reduce. It doesn’t mean the government are lying, but you have to be careful of choosing a particular method of inflation to prove a particular point.
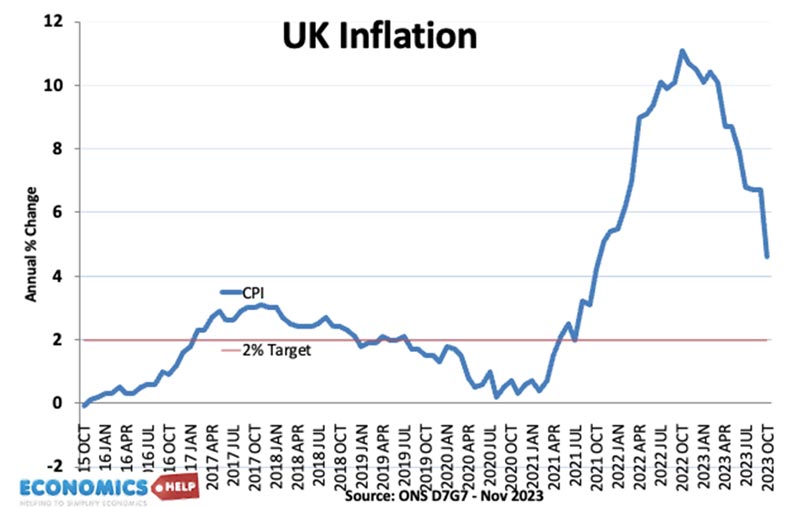
Another quick question. When teaching inflation, I will ask students what happened to prices between January and October? The correct answer is prices rose, at a slightly slower rate. But, many students will fall into the trap of saying prices fell. So this year, the UK Prime Minister had a target to halve inflation from 10% to 5%, and this was achieved, but it is unlikely to lead to a feel good factor. Prices are still very high, and they are still rising.
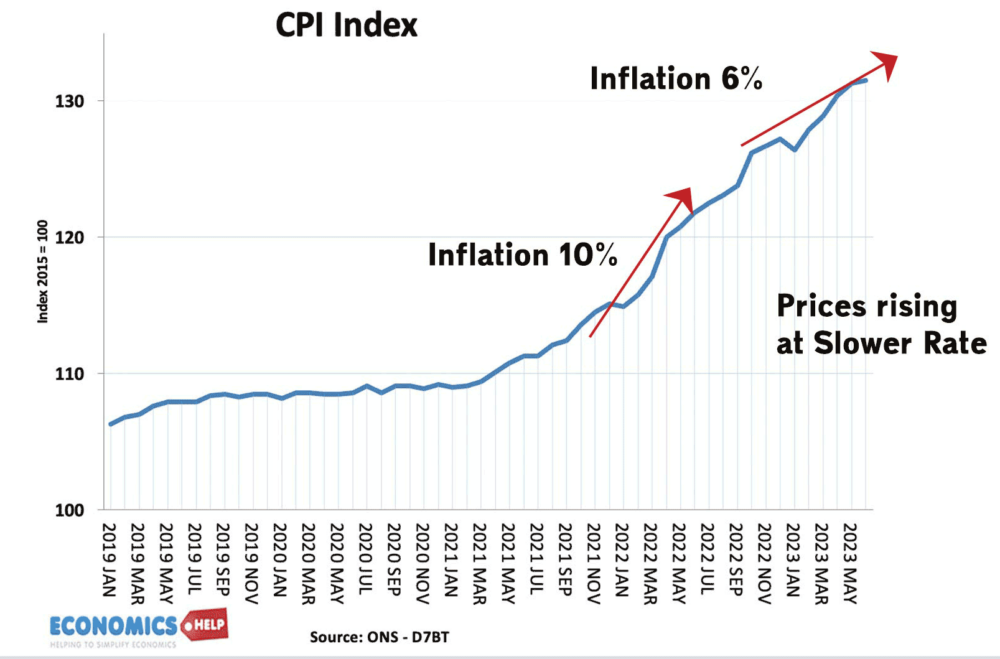
Why is this important. Perhaps a politician talks about reducing inflation, but a consumer thinks – but I see prices going up. Both are right, but it is easy to see the divergence of views.
Shrinkflation
Another form of inflation that has crept in in recent years, is shadow inflation or shrinkflation. The government are measuring the price of goods, but what happens if a company keeps price the same but reduces the size by 10%. If you have a target weight of chocolate to eat – and everyone should have a target weight of chocolate – you have to spend 10% more to get the same good – even though the price is the same. And this has become much more prevalent since the recent burst of inflation. However, the ONS say they do account for changes of weight. If the weight decreases, then this is adjusted in the calculation of inflation. Without weight-adjusted, headline inflation would underestimate inflation.
Inflation we don’t pay
Another quick thing is that recently I was in the supermarket and was shocked that Olive oil was selling for £7 a bottle, I’m sure I have bought olive oil for £2 a bottle in the recent past. Olive oil inflation is running at 50% and may go up even more. This is contributing to CPI inflation. However, I responded by not buying olive oil. I can live without it. I can use coconut oil or even just not use oil. There is a psychological block to spending £7 on olive oil. So although prices go up, I’m not actually paying them. This is the difference between CPI and Personal Consumption Expenditure Index. The PCE measures what people actually buy. Post-covid lettuces in America were selling for $6, but who spends $6 on a lettuce? This can actually cause the inflation rate to be actually higher than what we are paying for.
Alternative measures
An important thing to bear in mind, if you don’t trust government data, others are available. The Billion price index was a breakthrough for measuring inflation without government statistic agencies. Pricestats measures prices in real-time and has proved a good guide to future inflation as it doesn’t have the delays of government measures. The motivation for investors to have their own inflation is to have better future guidance on markets and interest rate decisions, they have no motivation to under-report inflation.
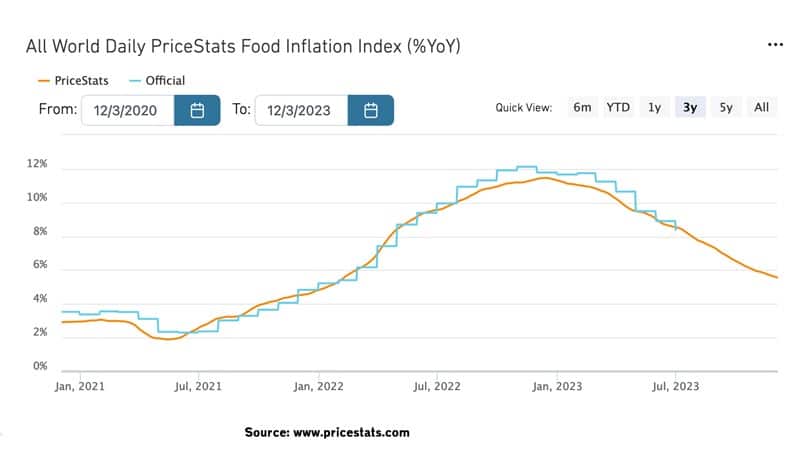
You can see how the pricestat data is accurately predicting future inflation trends.
So are the governments lying to you about inflation. No? But, inflation data can be tricky. A fall in inflation to 2.5% is only part of the story. Inflation measures the cost of living.
Related
Other sources
