- A lagging indicator is an economic statistic that tends to have a delayed reaction to a change in the economic cycle.
- A leading indicator is an economic statistic that tends to predict future changes in the economic cycle.
- A co-incident indicator is a variable that changes with the whole economy.
The recession of 2008 was very deep, but which statistics indicated it would happen?
Lagging and leading indicators explained
- At the start of a recession, we may get a fall in share prices and fall in consumer confidence – these are leading indicators of a change in economic mood; people expect fortunes to deteriorate and start spending less.
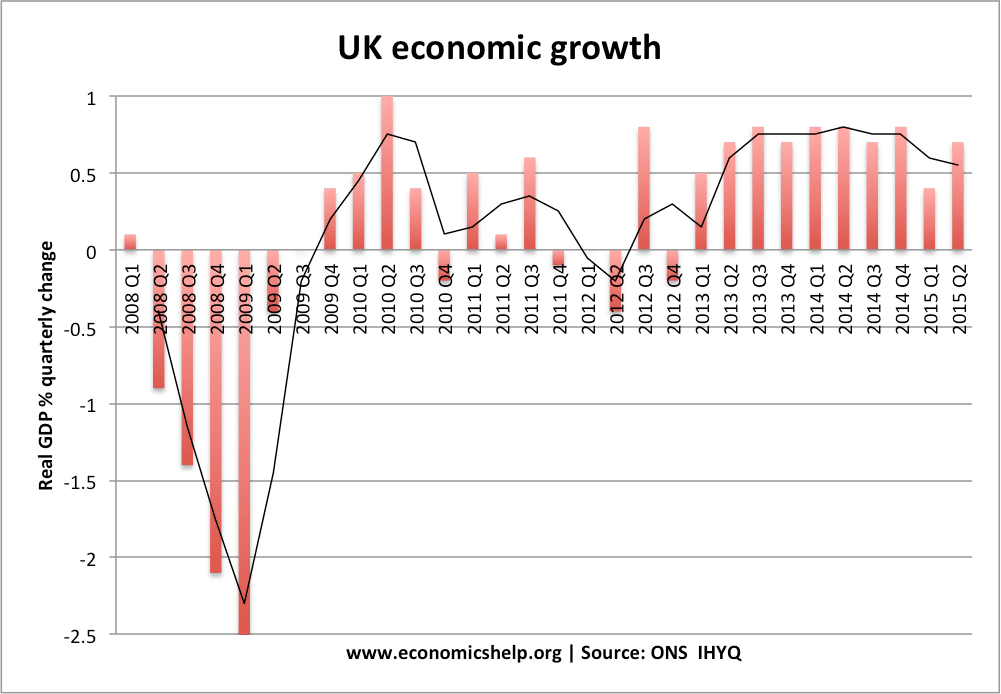
- As the economy goes into recession, GDP falls. This is the best co-incident indicator. Though we have to remember, GDP stats is initially an estimate, it may get revised up to three years later.
- Unemployment is often a lagging indicator. It takes time for firms to respond to decline in output by getting rid of workers. Workers may be protected by contracts and so not lose job straight away.
- When the economy recovers, we will see a rise in business and consumer confidence and GDP rises. However, it may take time for firms to have the confidence to find and employ new workers.
Lagging indicators
- Unemployment
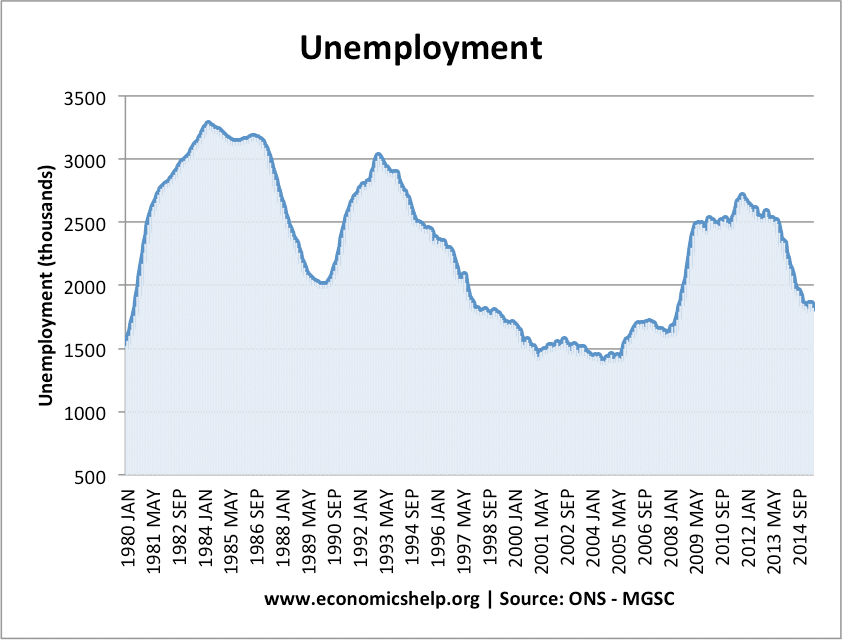
The UK recession of 1980/81 saw unemployment rising into 1983 – even when the economy had recovered. It took late into the 1980s for unemployment to fall in response to economic growth. However, after the 2008-12 recession, unemployment fell quicker, making it less of a lagging indicator, due to more flexible labour markets.
2. Consumer price index for services. In a recession, we will tend to see downward pressure on the price of services. With higher unemployment, there is downward pressure on wages, and these will feed through into lower prices for services, such as hairdressers, cleaners, e.t.c. In a period of strong growth, it will tend to put upward pressure on wages, increasing the price of labour-intensive services.
3. Quantity of loans

After an economic downturn, there will be a decline in the quantity of loans. People will stop taking out new loans and so the overall level will start to decline. But, after a period of economic growth, loans will be high.
Real GDP revisions
Usually, we would count real GDP as a coincident indicator. Real GDP is the indicator of economic growth. However, first estimates of GDP can be misleading and they often miss radical changes in GDP. Initial estimates often involve a degree of guessing and so miss out changes.
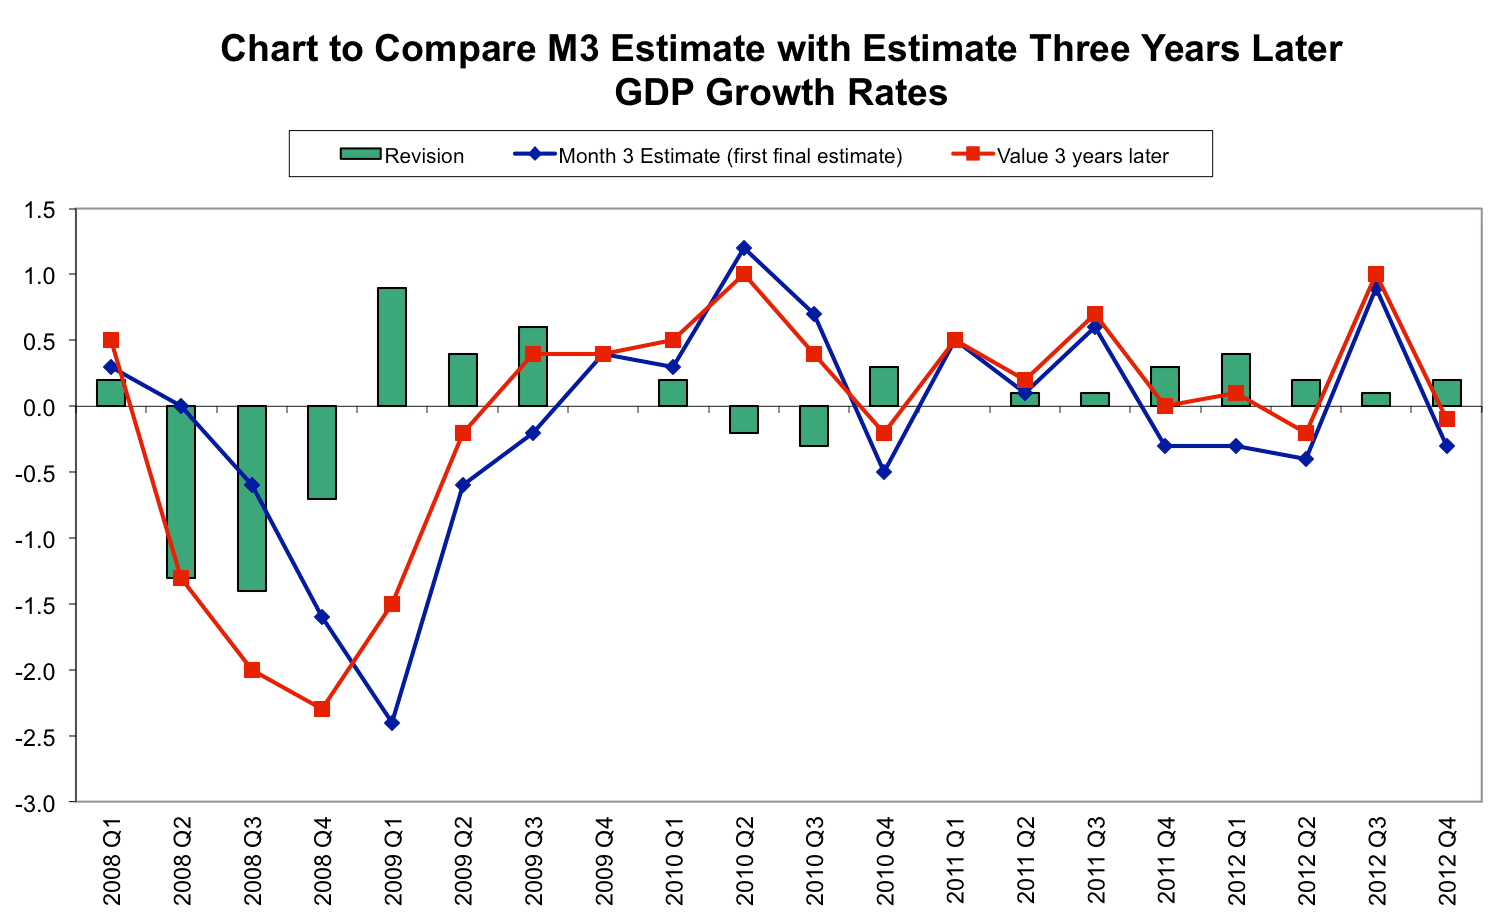
The above graph shows that initial estimates of real GDP were higher than final revisions 3 years later. First month estimates for economic growth in Q2 2008 was 0.2%. Yet three years later, this positive growth has been downgraded to -0.6 – a serious downturn.
The first-month estimate for Q3 2008 was -0.5%. But, three years later, this was revised to a much more serious -1.7%
When growth is more stable, revisions tend to be much smaller. We can see accurate real GDP stats as a potential delayed indicator.
Leading indicators
- Consumer confidence
- Managers purchasing index
- FTSE-250
- Bond yields
- Money supply
- Consumer confidence. Often one of the best and quickest indicators of future economic activity.
source: GFK Consumer Confidence Barometer | 30 November 2012
Consumer confidence fell early in 2008, hinting at future falls in real GDP.
2. Purchase of capital goods. Investment in new capital is a barometer of the business cycle. If firms are confident about future demand, they will purchase more capital goods. This purchase will, in itself, help increase economic activity. In the lead-up to a recession, you would expect firms to cut back on capital purchases.This can be illustrated through indexes, such as IHS Markit’s Purchasing Manager’s Index, or PMI,
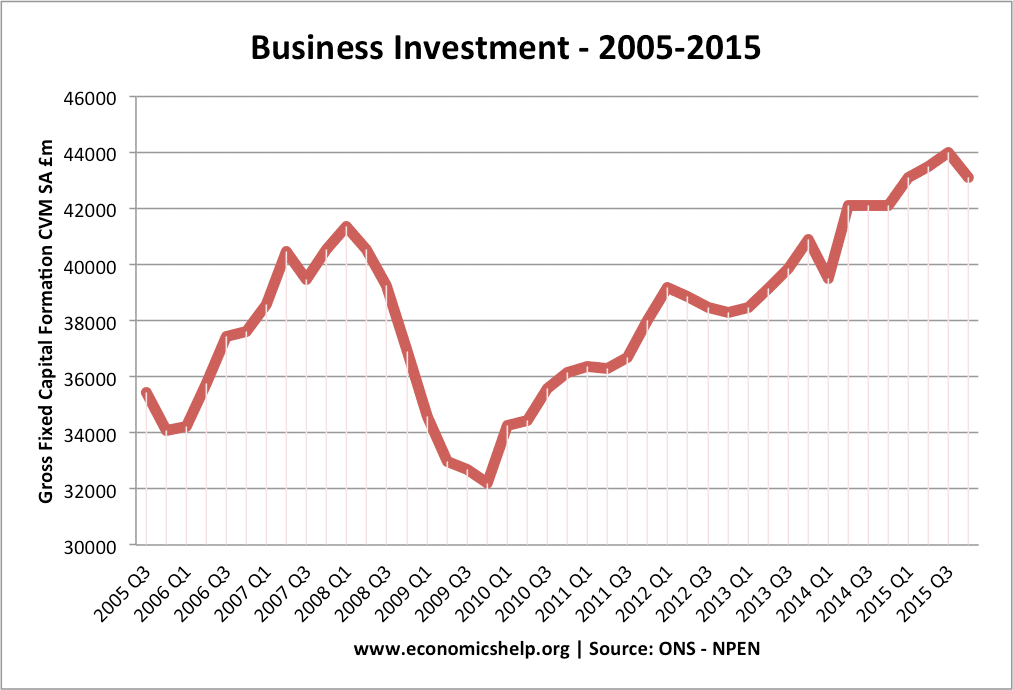
Source: ONS NPEN
Business investment fell in Q2 2008 – just at the time real GDP starts to decline. The trough of investment was a similar time to the upturn in real GDP.
Construction sector. The construction sector is an indicator of economic activity. It tends to be one of the most volatile sectors. Falling demand for new building permits is an indicator construction sector is going into a downturn and this will forewarn a larger economic downturn.
FTSE-250. The stock market may reflect investor sentiment. Expectations of recession causing share prices to fall, especially in critical sectors like construction and travel.
Bond yields. A fall in long-term bond yields can indicate markets expect a recession and future cuts in interest rates. It also shows investors want the security of government bonds rather than more risky shares. A negative yield curve is an indicator of negative expectations.
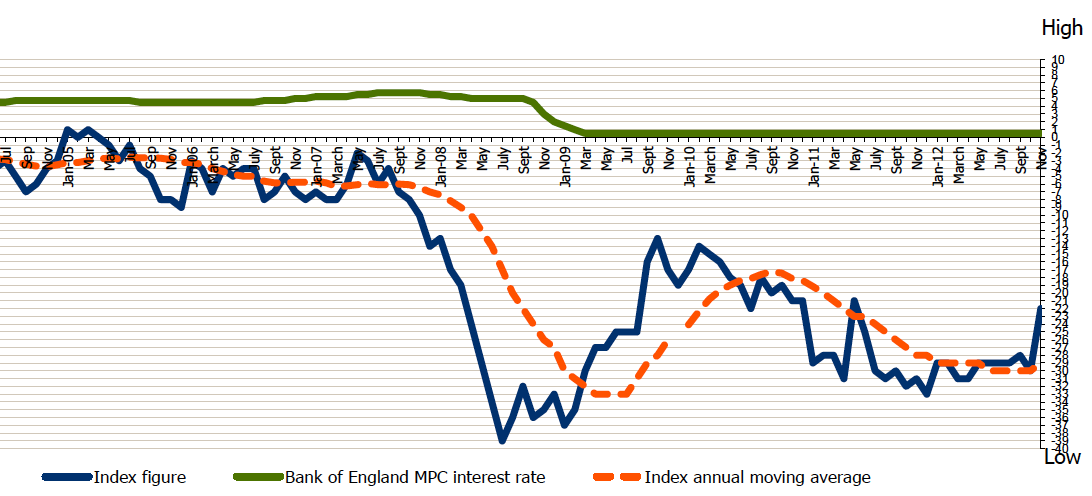
Money supply. The money supply is often considered a leading indicator. Fall in money supply and an indicator of economic activity. However, in last recession, the money supply (both broad and narrow) was a lagging indicator.

After 2008 recession, the money supply didn’t fall immediately. It took until the start of 2009 for M4 growth to decline and the second half for M0 to fall.
Evaluation
It can be difficult to know the exact state of the economy. Certain leading indicators can often be a good guide to future trends. In particular, levels of consumer and business confidence are often a good guide to expectations. Then we see statistics, such as the purchase of capital goods and average weekly hours worked as an indicator of where the economy may be going.
Some indicators lag behind the rest of the economy. The traditional lagging indicator is the rate of unemployment. However, in recent years, unemployment has become more responsive to economic cycle – an indication it is easier to hire and fire workers.
Also, statistics we may expect to be leading or coincident (such as money supply) can be more unpredictable in practice, with last recession, money supply growth lagging behind changes in real GDP.
Related
leading indicators are very helpful to identify current market trends.