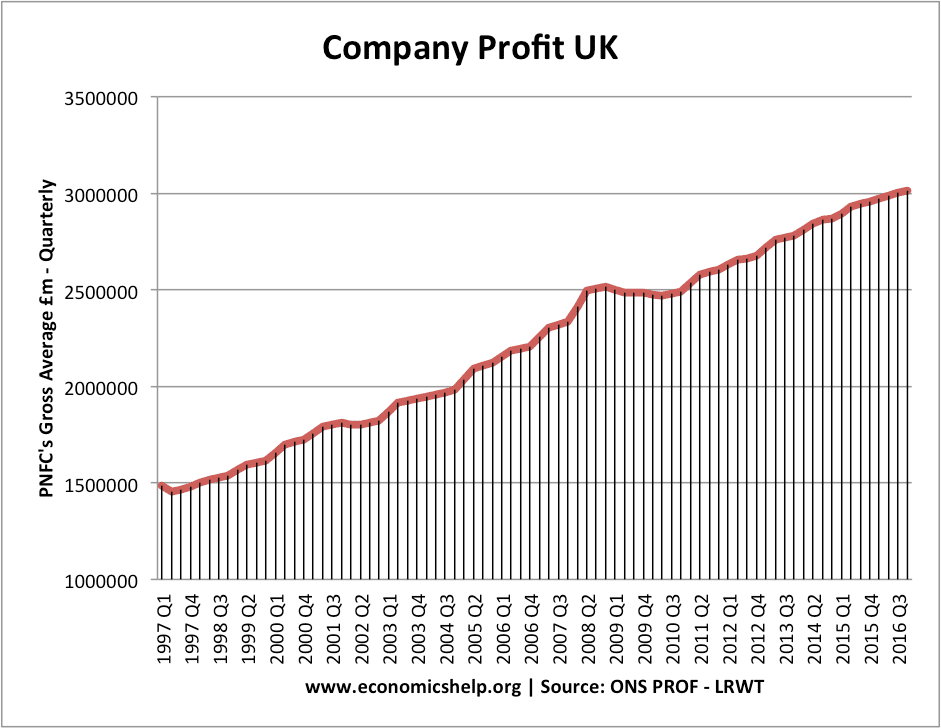
Level of Company Gross Profit in the UK
Profitability of companies – ONS
In 2016, Gross profit by UK non-financial companies was £2,993,446 million or £2,993 bn
Cash reserves of companies have increased. In 2014, the Bank of England estimated cash reserves of UK firms at £284 billion See: Cash reserves
PNFC – Private non-financial companies.
- Since 2009, company profit has grown at a faster rate than wage growth.
- Rising company profitability has led to a rise in corporation tax revenue.
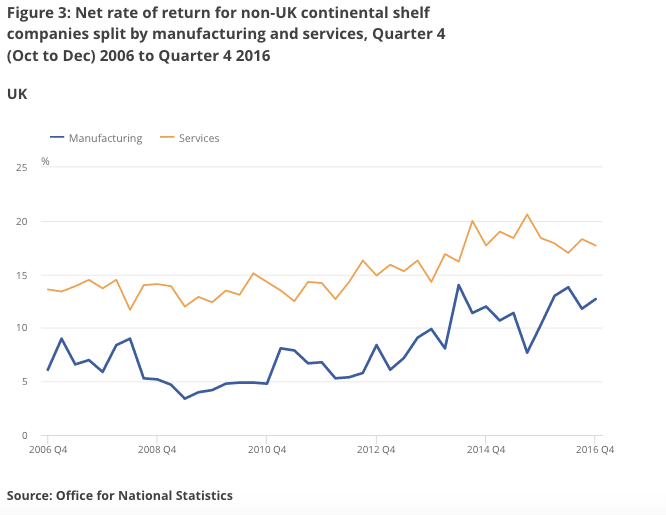
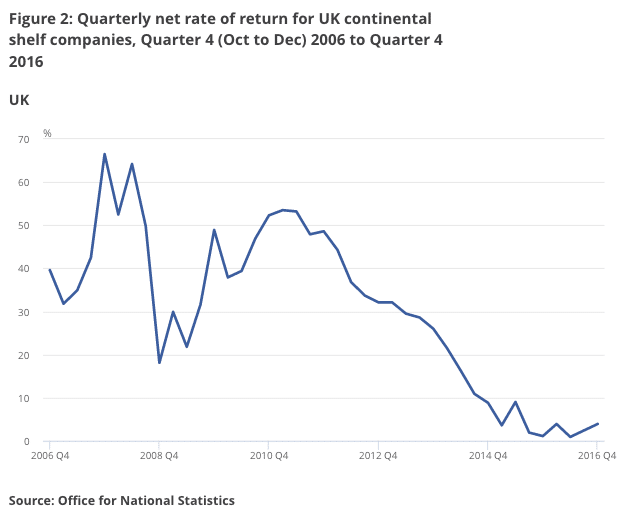
- Rise in profit has occurred despite decline in returns from oil and gas companies.
Reasons for rising company profitability
- Low wage growth
- Low-interest rates reducing costs of borrowing
- Relatively strong consumer spending in recent quarters.
- Lower non-wage costs, e.g. zero-hour contracts offering greater flexibility.
- Devaluation in the Pound has caused many firms to keep foreign prices the same and have a bigger mark-up (profit)
- Increased tourist spending since devaluation (e.g. luxury brands like Mulberry)
Rate of return on capital
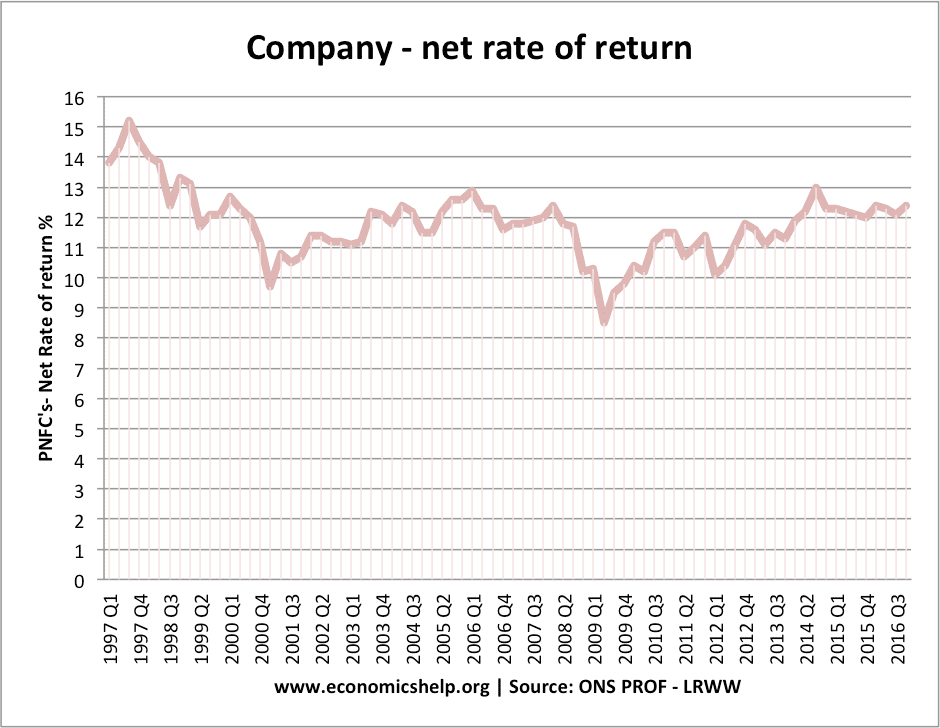
“The rate of return is calculated as the economic gain (profit) shown as a percentage of the capital used in production. “Net” means the rate of return excluding capital consumed and accounting for capital stocks at their current value. Capital consumed refers to the decline in the current value in the stock of fixed assets (for example, due to depreciation).”
Profitability by sector
Since
Related
The Factor of labor wage won’t affect, because most immigrant left UK, as far as I know the labor cost increased since July 2017.
thanks for good info