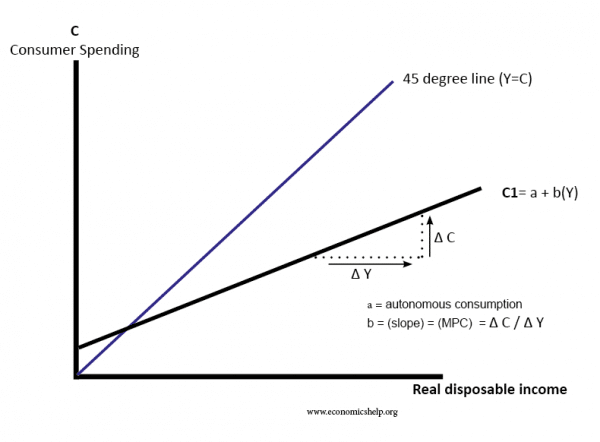
The Keynesian consumption function expresses the level of consumer spending depending on three factors.
- Yd = disposable income (income after government intervention – e.g. benefits, and taxes)
- a = autonomous consumption (consumption when income is zero. e.g. even with no income, you may borrow to be able to buy food)
- b = marginal propensity to consume (the % of extra income that is spent). Also known as induced consumption.

Consumption function formula
- C = a + b Yd
This suggests consumption is primarily determined by the level of disposable income (Yd). Higher Yd leads to higher consumer spending.
This model suggests that as income rises, consumer spending will rise. However, spending will increase at a lower rate than income.
- At low incomes, people will spend a high proportion of their income. The average propensity to consume could be one or greater than one. This means people spend everything they have. When you have low income, you don’t have the luxury of being able to save. You need to spend everything you have on essentials.
- However, as incomes rise, people can afford the luxury of saving a higher proportion of their income. Therefore, as incomes rise, spending increases at a lower rate than disposable income. People with high incomes have a lower average propensity to spend.
Implications of consumption function
If you cut income tax for those on low income, they tend to have a higher marginal propensity to consume this extra income. Therefore, there is a large increase in spending. People with high incomes will tend to have a lower marginal propensity to consume. If they benefit from a tax cut, they will save a greater proportion.
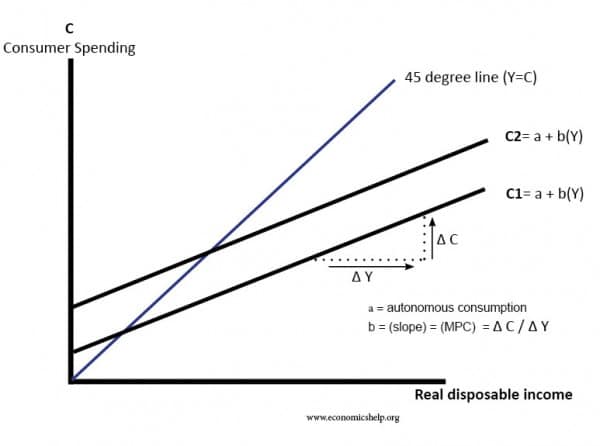
Shift in the consumption function

In this diagram, the consumption function has shifted to the upwards (to the left. (C1 to C2). This means consumers are spending a higher % of their income. This could be due to a rise in property prices which increases consumer confidence and lead to higher consumer spending.
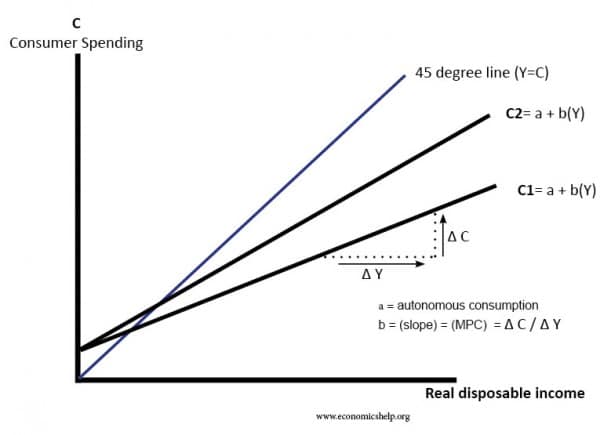
Increased marginal propensity to consume

In this diagram, the consumption function has become steeper. This means the value of b (MPC) has increased. Therefore, people are spending a higher % of their additional income. This could be due to rising confidence, lower saving and easier availability of credit.
Limitations of consumption function
In the real world, people are influenced by other factors
- Life cycle factors – e.g. students more likely to borrow and spend during university days.
- Behavioural factors – e.g. people may be influenced by general optimism.
Other theories of consumption
Consumption is primarily determined by levels of income but also other factors such as:
- Dependants such as children
- expectations of future income,
- total wealth
- Stage in the life cycle
- Marginal propensity to consume
Permanent income hypothesis (Milton Friedman) This is a theory that a person’s consumption is determined, not just by current income, but also future expected income. It suggests that consumers will attempt to ‘smooth consumption’ over their lifetime, e.g. borrowing as a student, running down savings in retirement.
Life-cycle hypothesis (Richard Brumberg & Franco Modigliani). Another theory that people attempt to smooth consumption over their lifecycle. This suggests that spending will be dependent on current income, future expected income and also a function of wealth. See: Life-cycle hypothesis
Related

The notes are clear and thus enhance quick understanding. Thanks a lot.
well elaborated
Very clear and easy to understand ….thanks
I have a question does the value of consumption include the price of the good including consumption tax or without consumption tax, i.e. VAT?
The explanation is easy and elaborative. Thanks EconomicsHelp.
thanks the notes are short and precise
as long as consumption depends on income in a reasonably stable way,it does not matters which is correct function whose statement is this or which theory it belongs to?
The explanation is comprehensiveensive, thanks.
My lecturer is confusing but these notes have helped me understand this concept. Thank you so much.
Please I’m working on an assignment which gave me the consumption function as C=a+bY and I’m to explain that consumption function and determine the level of consumption in this consumption function
Please can I get more clarification about how to go about it
what does the 45 degree line represent in the diagram?
Good presentation i like it…
It was well elaborated and this made me understand it.
Thank you
Powerful and helpful notes 🙏🙏🙏🙏🙏🙏