Readers Question: Explain with the help of diagrams the equilibrium of a firm having monopoly power in the market in the short-run and long-run?
The diagram for a monopoly is generally considered to be the same in the short run as well as the long run.
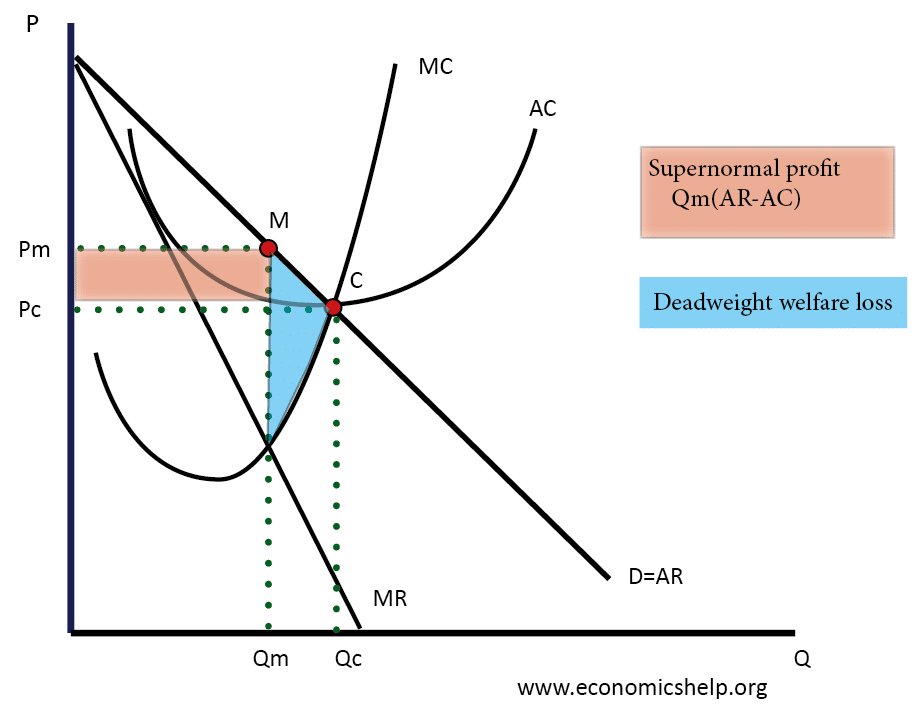
- Profit maximisation occurs where MR=MC. Therefore the equilibrium is at Qm, Pm. (point M)
- This diagram shows how a monopoly is able to make supernormal profits because the price (AR) is greater than AC.
- Usually, supernormal profit attracts new firms to enter the market, but there are barriers to entry in monopoly, and this enables the monopoly to keep supernormal profits.
Difference between monopoly and competitive markets in the long-run
In the short run, firms in competitive markets and monopolies could make supernormal profit.
However, there is one major difference.
- In monopolies, there are barriers to entry – which prevent new firms from entering the market
- In competitive markets barriers to entry and low – so new firms can enter the market causing lower profit.
- Therefore, in the long-run in competitive markets, prices will fall and profits will fall.
- However in the long-run in monopoly prices and profits can remain high.
Efficiency and monopoly
- Monopolies set a price greater than MC which is allocatively inefficient.
- By producing at Qm, the monopoly is productively inefficient (not lowest point on AC curve)
- With less competition, a monopoly has fewer incentives to cut costs and therefore will be x-inefficient.
Welfare loss to society
- In a competitive market, the output will be at Pc and Qc. (point C)
- In a monopoly, the output will be QM and PM – causing a fall in consumer surplus.
- Monopoly also causes a fall in producer surplus (less is sold). But, some of the consumer surplus is captured by firms (from setting higher price).
- The blue triangle shows the net loss of consumer and producer surplus to society.
Long run average costs in monopoly
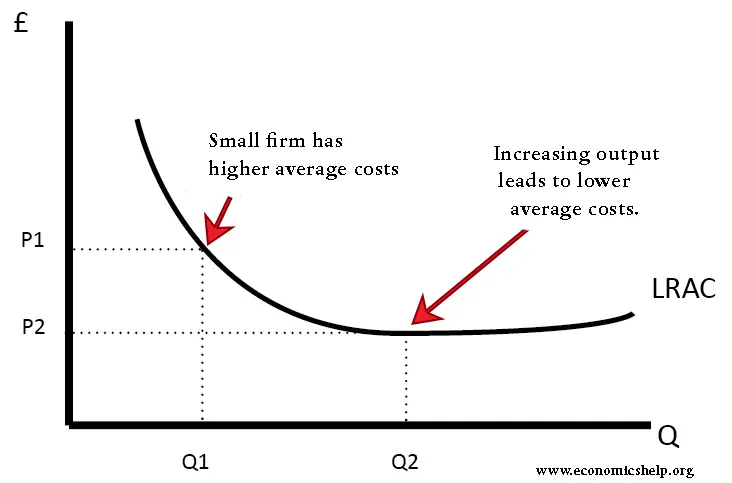
It is assumed monopolies have a degree of economies of scale, which enables them to benefit from lower long-run average costs.
In a competitive market, firms may produce quantity Q2 and have average costs of AC2. A monopoly can produce more and have lower average costs. This enables efficiency of scale.
Related
- Monopolistic competition – where the short-run equilibrium is different from the long-run equilibrium
- Monopoly – advantages and disadvantages.
distinguish between long and short runs?
Short run is when all factors of production are at ‘caterus paribus’ state while long run is when all factors of production are varied.
the long run equilibrium in the monopolistic market
I firms are in no profit no loss
II There is no entry or exists in the firm
can you say which statements are correct?
Long-run period has normal profits while short run has supernormal profits.
with the aid of a diagram for monopoly equilibrium, explain the disadvantages of monopoly.
With the aid of a diagram explain how the society suffers under monopoly
would like to understand short run and long run position of a firm
Differentiate between the perfect competition and monopoly in the short run,with the aid of graphs
According to me short run is when firms is enjoying supernormal or abnormal profit due to small numbers of firm in the market while long run is when firm are enjoying normal profit because their is no restriction hence more firm will enter the market.
So you’re saying that Long Run and Short Run are Normal or Abnormal?
Short-run is when factors of production are fixed except labour is variable while the long-run all factors of production are variable
I need more on monploy and its disadvantage
how do monopolistic firm make profit in the short run and long run
Why does a monopoly make abnormal profit both in the short run period and long run period
what happens to the diagram when a new market enters the monopoly
Demand would become more elastic and price a little lower.
How does a monopoly market make profit in long run?
How can a perfect competitive market make supernormal profit in the short run and why does this happen.
1 st one is correct
In profit making, the monopolist profit could be ——– both in short and long runs
Does the marginal cost of the monopoly differ in the short run and long run?