Households are considered by the Government to be in ‘fuel poverty’ if they would have to spend more than 10% of their household income on fuel to keep their home in a ‘satisfactory’ condition. It is thus a measure which compares income with what the fuel costs ‘should be’ rather than what they actually are. Whether a household is in fuel poverty or not is determined by the interaction of a number of factors, but the three obvious ones are:

- The cost of energy.
- The energy efficiency of the property (and therefore, the energy required to heat and power the home)
- Household income.
Fuel poverty 2008-18

Fuel poverty 2022
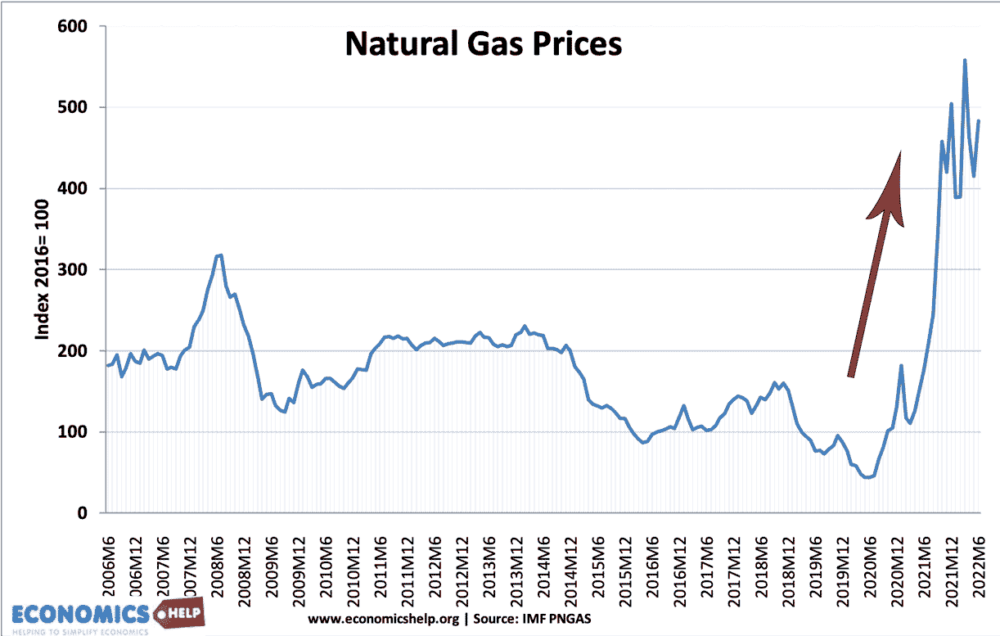
The remarkably rapid rise in energy prices (gas and electricity) during 2021/22 caused an unprecedented rise in fuel poverty, with bills in the UK forecast to rise from an average of £1,100 to at least £3,600. An estimated 18 million households (or 65.8%) (link) will slip into the definition of fuel poverty, highlighting the unprecedented nature of rising bills.

Using this definition there are 5.5 million people in the UK classified as being ‘poor’.
![]()
See more on energy crisis 2022
Fuel poverty

4.0 million households in England were classified as being in fuel poverty in 2009 (18% of all households). This is three time the number of households that were in fuel poverty at the low point in 2003, and there have been increases in each year since 2003. It is, however, still lower than the number in the mid-1990s.
Fuel poverty is highest amongst private rented sector, where 20% of people are classed as being in fuel poverty.
Fuel poverty is higher among single person householders (e.g. old person living alone). This is because income is proportionately lower, yet fuel costs are only slightly lower.
Increases in Energy Prices
UK Energy prices in real terms

In recent years, the price of fuel and energy have risen above the rate of inflation. Yet, many pensioners and those on benefits have seen their benefits rise in line with CPI inflation.

This figure may be set to rise as electricity and gas bills are set to rise. Oil prices are also continuing an unrelenting climb with some in OPEC warning of a $200 a barrel.
Income Inequality in UK
 see also: income inequality in UK
source: graphs: Fuel poverty report 2011
Related
4 thoughts on “Fuel Poverty – Definition and Statistics”
Comments are closed.