Following on from previous posts – How much has government spending been cut – | How was budget deficit cut by 25%?.
It will be useful to republish some data from Mainly Macro – on a post UK austerity and some facts
UK Cyclically adjusted primary deficit
2010 | 2011 | 2012 | 2013 | |
IMF 2 | -6.1 | -3.9 | -2.8 | -1.5 |
OECD [3] | -5.8 | -4.1 | -3.0 | -1.9 |
The cyclically adjusted deficit strips away the part of the deficit related to the economic cycle. The actual budget deficit is much higher – because in a recession, borrowing increases as tax revenues fall and welfare payments increase.
A primary deficit takes away interest payments.
The cyclically adjusted primary deficit could also be viewed as the ‘underlying structural deficit’
The sharp fall in the cyclically adjusted primary deficit from 6% of GDP to 1.5% GDP in 2013, shows a contractionary fiscal policy – the combination of spending cuts / freezes and tax increases.
More Detail on type of spending cuts.
Government consumption | 2011 | 2012 | 2013 | |
OBR March | 0.3 | 0.5 | -1.1 | |
OECD June | 0.1 | -0.7 | -1.8 | |
Government investment | ||||
OBR March | -13.0 | -5.0 | -3.6 | |
Government employment | ||||
OBR March [4] | -4.0 | -2.0 | -1.9 |
Government investment makes up only about a tenth of government spending on goods and services (G for short), so putting the two together the OBR numbers suggest a fall in G of 1% in 2011, about flat in 2012 and a fall of almost 1.5% in 2013. So, the ‘contribution to growth’ of G to GDP is to reduce it by a bit more than a quarter of one percent in 2011 and 2013, with no impact in 2012. (OBR forecast (pdf), Table 3.4.)
This is similar to the suggested figures on government spending here.
However, as I mentioned in previous posts and by Wren-Lewis here. Typically, with economic growth close to the long run trend rate of 2%, you would expect to see a similar increase in real government spending of 2-3% Zero government spending
Therefore, zero spending increases need to be seen in this context. Spending freezes have had the impact of reducing potential aggregate demand growth.
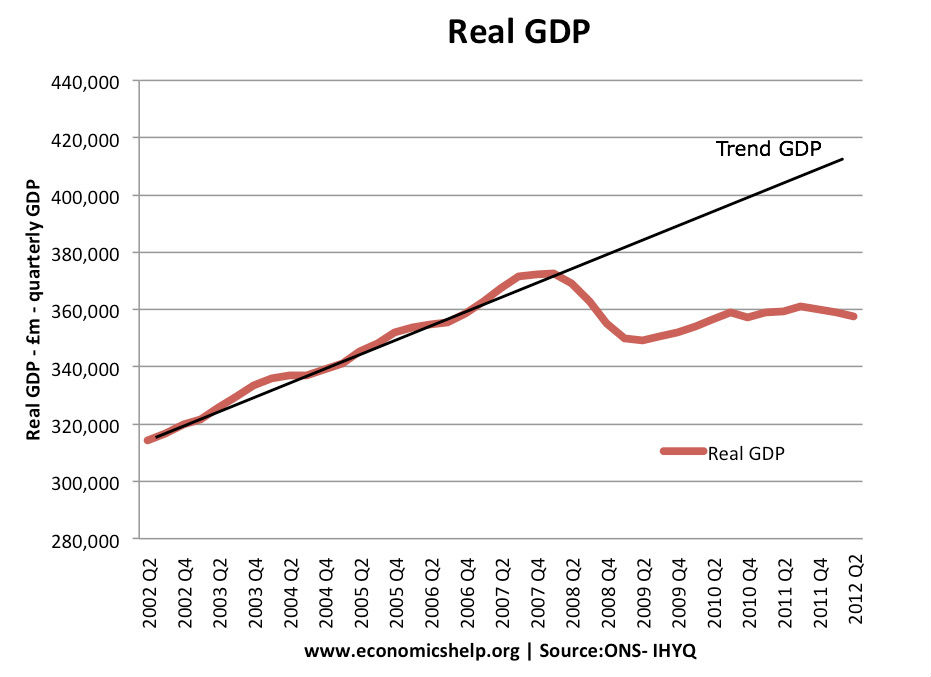
zero growth in government spending seems consistent with the zero growth in real GDP.
Multipliers and Liquidity trap
The other crucial issue is the size of the multiplier effect. As the IMF stated recently, the impact of contractionary fiscal policy has been bigger than they expected. The IMF admitted that the likely multiplier effect in the current climate is bigger than one. Therefore, spending cuts have had a bigger percentage impact on GDP.
Related
- Will cutting spending bring growth?
- Austerity facts – mainly macro
[2] IMF Fiscal Monitor October 2012 Statistical Table 2.
[3] OECD Economic Outlook June 2012.
[4] Final quarter of financial year, so 2011 figure is actually 2012Q1/2011Q1.