Question: re: article on the great recession. How did the money supply affect the credit crunch and recession?
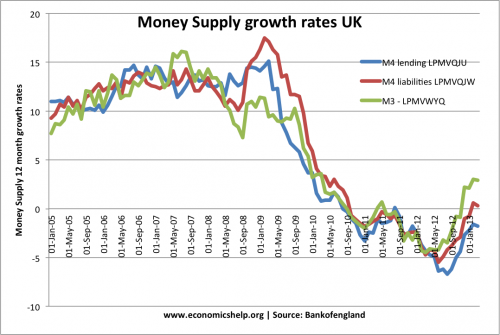
Firstly, we can look at the statistics for the money supply growth rate in the UK.
Source: Bank of England
This shows strong growth in the broad money supply in the years leading up to the credit crunch. – An annual growth rate of 10%. By 2010, broad money supply growth had become negative. This is a result of the fall in bank lending we saw in the recession, and the corresponding effect on broad money supply growth.
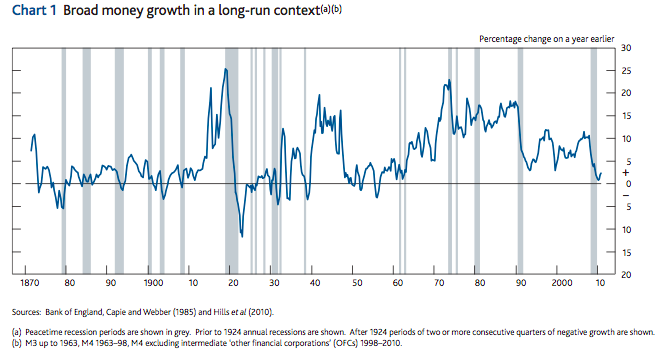
Did money supply growth play a role in the credit boom? The main issue was the rise in bank lending, and the type of unsustainable bank lending. The growth of the broad money supply didn’t give a clear sign of an underlying boom. If you look at the money supply from a historical perspective, it has always been difficult to see an easy link between the money supply and the rest of the economy.
Broad money supply over past 100 years.
source: Bank of England
Money Supply in the credit crunch
This first graph suggests that at the heigh of the credit crunch 2008 to May 2009, the money supply was rising at a fast rate, which you wouldn’t expect. This is true, but it only tells half of the story.
Money supply and velocity of circulation
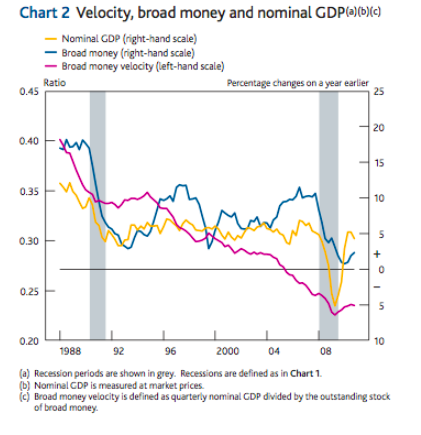
The money supply is the stock of money in the economy. However, it is also very important to know the velocity of circulation of money. The velocity refers to the amount of times this money changes hands in a year. The velocity of circulation has been in long-run decline because of various changes to financial sector. But, in the credit crunch, the velocity fell sharply.
Velocity of Circulation = GDP at current prices / average value of the money stock
In 2009, we see an increase in the money supply because of quantitative easing (Central Bank creating money and purchasing bonds from banks). This increased the money supply, but during this period the velocity of circulation fell. Banks weren’t lending the extra money. In a recession, people spend less so money changes hands more infrequently.
Therefore, money supply growth of 15% was misleading to economic activity.
source: B of E quarterly bulletin 2011
Money stock and Velocity of circulation
| 2008 Q3 | -7.66 |
|---|---|
| 2008 Q4 | -12.27 |
| 2009 Q1 | -17.82 |
| 2009 Q2 | -17.34 |
| 2009 Q3 | -13.45 |
| 2009 Q4 | -9.6 |
ONS – sadly discontinued series
M4 excluding OFC
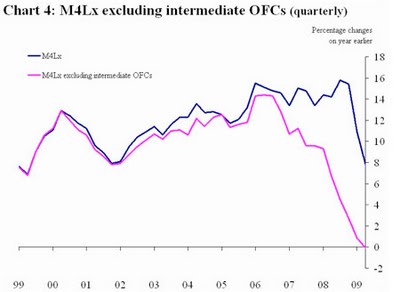
Another issue is which measure of money supply to use. The Bank of England are pushing M4 – excluding intermediate OFC’s (shadow banking)
Other graphs of interest
M0 Notes and Coins
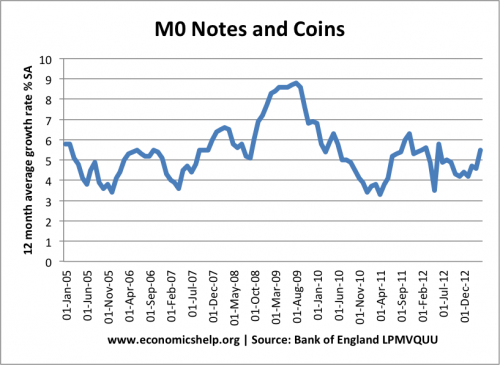
The narrow definition of money supply is notes and coins in circulation.
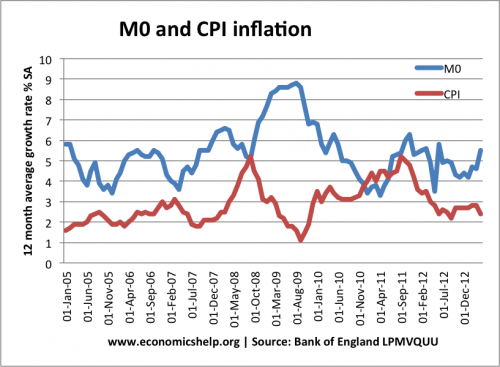
Related

