A selection of graphs and statistics about US Federal debt and the US Federal budget deficit / surplus.
US Federal Deficit since 1946
The federal deficit is the annual difference between federal spending and federal tax revenues. For example, in 2012,
- Federal receipts (tax e.t.c) were $2,450.2 billion ($2.4 trillion) (15.8% of GDP)
- Federal spending was $3,537.1 billion (22.8% of GDP),
- leaving a federal deficit of $1,087.0 billion ($1.1 trillion) (7.0% of GDP)
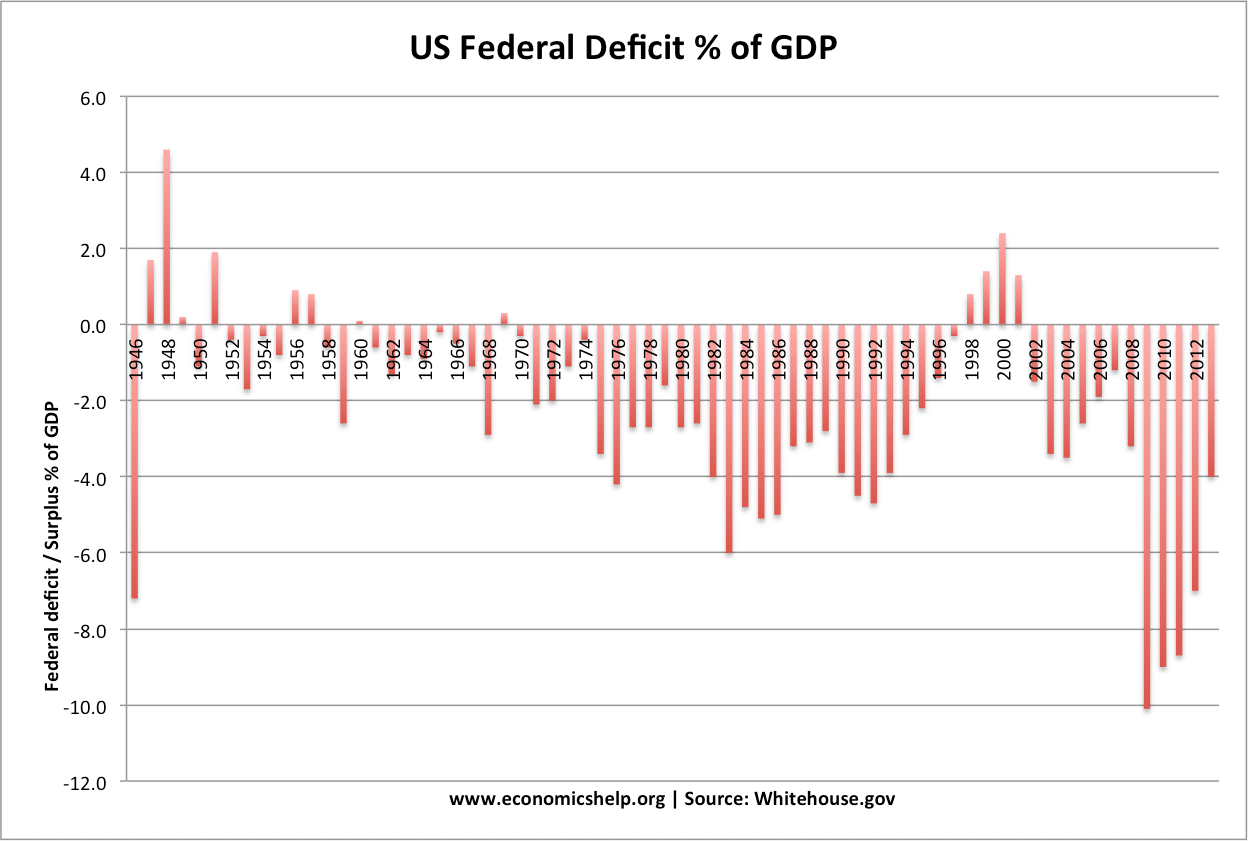
Source: Whitehouse.gov
US borrowing during World War Two
| Budget deficit % of GDP | |
| 1942 | -14.2 |
| 1943 | -30.3 |
| 1944 | -22.7 |
| 1945 | -21.5 |
| 1946 | -7.2 |
| 1947 | 1.7 |
During the Second World War, the deficit reached over 30% of GDP in 1943!
US Federal deficit since 1995
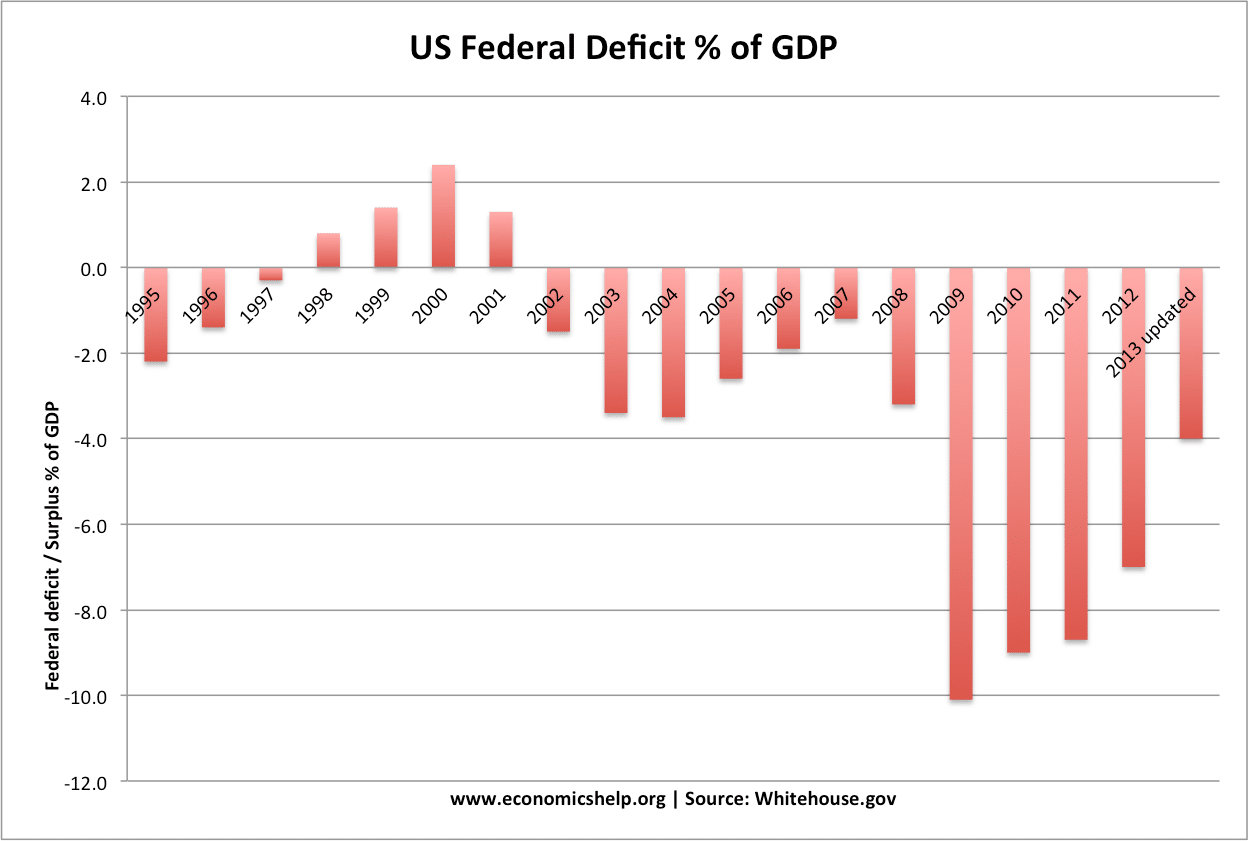
The US budget deficit has fallen in 2013 more than initial forecasts. The government says the deficit for the 2013 budget year totaled $680.3 billion, down from $1.09 trillion in 2012. (a fall of 37%. see: Washington Post) The fall in the deficit is due to spending cuts (-2.4%) which took place in March and due to rising tax revenues (+ 13%) from higher economic growth.
The Whitehouse estimate for 2013 was originally 6% of GDP, but the CBO have updated that to a deficit of just 4% of GDP.
Commentary
The US faced a political battle about raising the debt ceiling. But, recent budget data offers encouraging signs of a reduction in government borrowing. Importantly, the biggest reduction in the federal deficit came from a surge in tax revenues due to economic growth. The biggest challenge facing the US economy is to maintain a strong economic recovery. This will be the best way to continue improve short-term and long-term debt projections.
Given the rate of deficit reduction, there was no economic logic to raise the threat of massive spending cuts, which would only have risked plunging the economy back into recession.
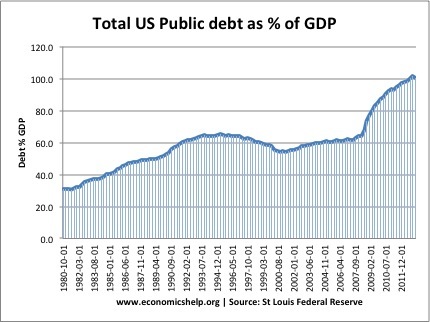
US National Debt since 1980
US national debt since 1900

US Federal debt has increased to over 100% of GDP
US Debt forecasts
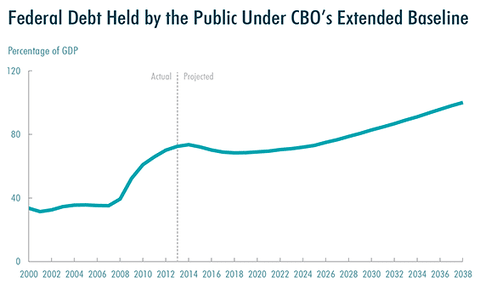
The CBO forecast that federal debt will fall before continuing to slowly rise for the next 20 years. The rising long term debt projection is due to ‘entitlement’ spending commitments, such as health care and pensions. With an ageing population, there will be increased government spending, but slower growth in tax revenues. However, debt projections become increasingly difficult, the further in time we look. It depends significantly on the rate of economic growth, the growth of tax revenues, and also legislation such as welfare reform / pension age e.t.c.
Related