US debt and deficit stats

A selection of graphs and statistics about US Federal debt and the US Federal budget deficit / surplus.

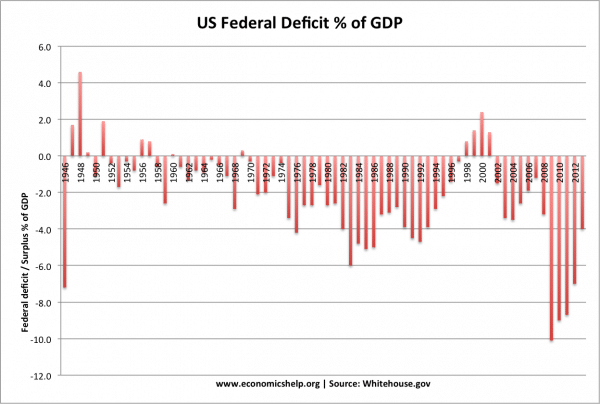
US Federal Deficit since 1946

The federal deficit is the annual difference between federal spending and federal tax revenues. For example, in 2012,

  • Federal receipts (tax e.t.c) were $2,450.2 billion ($2.4 trillion) (15.8% of GDP)
  • Federal spending was $3,537.1 billion (22.8% of GDP),
  • leaving a federal deficit of  $1,087.0 billion ($1.1 trillion) (7.0% of GDP)

budget-deficit-46-13

Source: Whitehouse.gov

 US borrowing during World War Two

Budget deficit % of GDP
1942-14.2
1943-30.3
1944-22.7
1945-21.5
1946-7.2
19471.7

During the Second World War, the deficit reached over 30% of GDP in 1943!

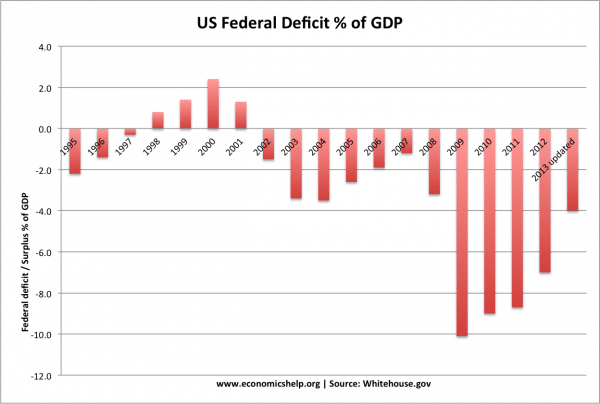
US Federal deficit since 1995

budget-deficit-95-13

The US budget deficit has fallen in 2013 more than initial forecasts. The government says the deficit for the 2013 budget year totaled $680.3 billion, down from $1.09 trillion in 2012. (a fall of 37%. see: Washington Post) The fall in the deficit is due to spending cuts (-2.4%) which took place in March and due to rising tax revenues (+ 13%) from higher economic growth.

The Whitehouse estimate for 2013 was originally 6% of GDP, but the CBO have updated that to a deficit of just 4% of GDP.

 Commentary

The US faced a political battle about raising the debt ceiling. But, recent budget data offers encouraging signs of a reduction in government borrowing. Importantly, the biggest reduction in the federal deficit came from a surge in tax revenues due to economic growth. The biggest challenge facing the US economy is to maintain a strong economic recovery. This will be the best way to continue improve short-term and long-term debt projections.

Given the rate of deficit reduction, there was no economic logic to raise the threat of massive spending cuts, which would only have risked plunging the economy back into recession.

Read more

US economy stats

A short summary of main US economy stats and where to find more detailed stats. Other data GDP: $16.66 trillion (Q-2 2013) GDP per capita $49,601 (2012) 10th, nominal; 6th, PPP Gini coefficient 0.48 (2011) Labor force 155.6 million (11.26 mil. unemployed) Related pages at economicshelp.org History of US national debt Other helpful external links …

Read more

Causes of US Budget Deficit

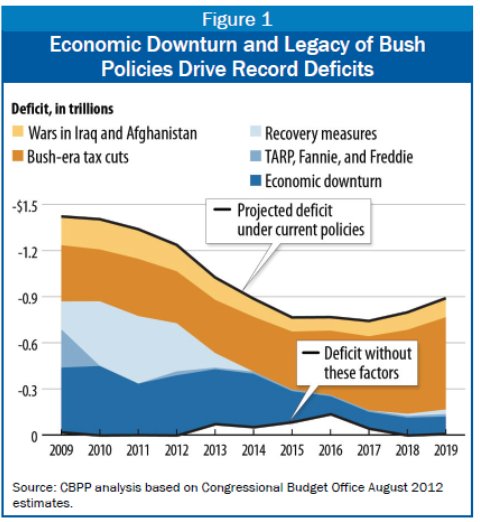
This graph illustrates some of the different causes of the US budget deficit.

causes-us-budget-deficit

Source: CBO estimates 2012 | via Krugman

This shows how the deficit has been affected by certain issues.

Cyclical factors

  1. Cyclical spending and lost tax revenues due to recession.
  2. Expansionary fiscal policy (economic recovery measures)
  3. Financial intervention to bailout banks and financial institutes.

Structural Factors

  • Bush tax cuts
  • Cost of wars (unexpected spending)

The particular graph doesn’t show other factors affecting the budget deficit, such as growth in health care spending, the cost of social security and factors related to an ageing population. But, it is interesting to see $0.9 trillion of the 2009 deficit (roughly 75%) was caused by cyclical factors.

Read more

Could US Make Same Mistakes as Europe?

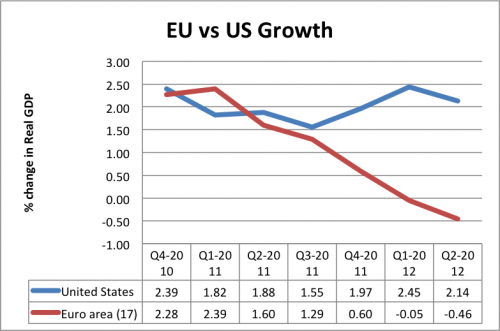
In 2009, US and EU unemployment rates both stood at 10% – but since then EU unemployment has increased to 12% and US unemployment fallen to 7.9%. (see: US v EU unemployment)

These contrasting fortunes in unemployment are a reflection of diverging rates of economic growth. Whilst, Europe has entered a double dip recession, the US has experienced a sustained economic recovery. It is also a reflection of different economic policy – the EU has become obsessed with reducing budget deficits, the US has given more focus to promoting economic recovery.

recession

However, in the face of concerns over levels of US government borrowing and impending debt ceilings, many in the US are pushing for a rapid fiscal consolidation.

But is US austerity necessary? and what will be the impact of austerity on a) the budget deficit and b) economic growth c) long-term structural spending and debt commitments?

Is Austerity Necessary in US?

total us debt

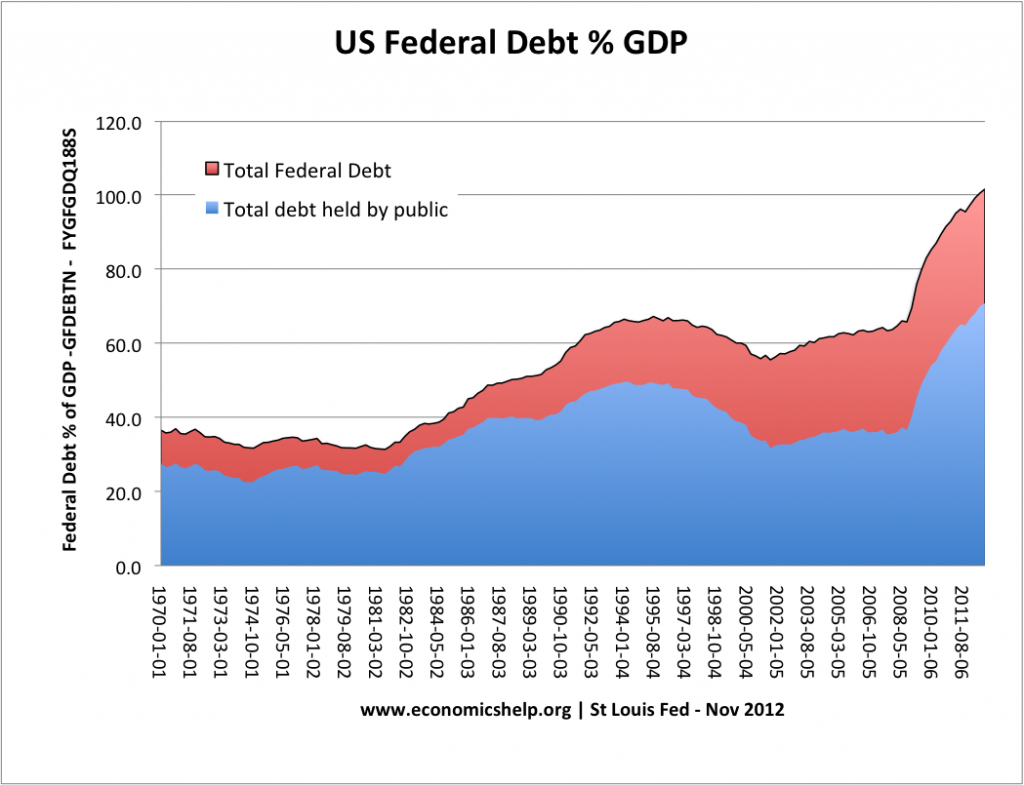
Total Federal Debt increased to 101% of GDP in Q2 2012. It is a sharp increase since 2008, when debt was just over 60% of GDP. But, this is to be expected in a recession as deep as past recession.

Read more

US Fiscal Cliff Explained

One of the most talked about issues in US politics is the US fiscal cliff.

The fiscal cliff refers to the situation at the end of 2012, where a series of tax increases and spending cuts (worth $600bn)  are due to come into force automatically. This amounts to  This will reduce the budget deficit, but cause lower growth. The alternative is to reject these planned budget cuts and allow the deficit to continue to grow. This will allow stronger economic growth, but leave the debt issue unchallenged.

A complicating factor for US politics is the debt ceiling. This is the legal amount by how much the government can borrow. The debt ceiling can be raised, but it has to go through the Senate to be voted on. This gives scope for political wrangling and efforts to push for some favoured spending cuts in return for allowing debt ceiling to be raised.

The debt ceiling was raised on January 30, 2012, to a new high of $16.394 trillion.

Read more

American Election Economics

I only take a passing interest in American politics. I’m just grateful not to live in Ohio, where voters have been subject to hours and hours of political ad campaigns. According to a newsnight presenter, if the 150,000  ads were all lined up, they would last for four consecutive days. (although I’m sure that would constitute cruel and unusual punishment. I think I’d talk after the first six hours). I’ve never seen an American political ad, but I doubt they explain the nuances of balance sheet recessions, liquidity traps and the optimal way to reduce debt to GDP ratios without con straining economic recovery.

But, despite economics being somewhat in the background, the re-election of Obama could be seen as a political confirmation that:

The recession was the result of the financial excesses in the lead up to 2008 – and not really the present administration.

us

Overcoming this unique balance sheet recession was always going to be difficult and long process. The US has performed moderately – but much  better than many of its fellow countries. To some extent Obama deserves credit for allowing a recovery – even if it could have been stronger.

In a country which loves the laissez faire ideal like no others, it’s interesting to still see solid support for the idea that government intervention can actually make markets work more efficiently. Obama supported the rescue of the automobile industry with government money. Romney opposed the use of federal funds. The bailout was a success, so it’s only fair Obama did well in the ‘rust belt’ north. Even the hurricane Sandy is a reminder that for real crisis, government rescue funds can play an invaluable role. Recent years have been a reminder that the highest ideal of government is not just to reduce taxes on the rich.

Read more

Item added to cart.
0 items - £0.00