How important is the budget deficit?

uk-net-borrowing-55-22-marks

Readers Question: How important is the budget deficit? The budget deficit is the annual amount the government borrow. The government usually financed the budget deficit by selling bonds to the private sector. US budget deficit likely to get bigger. To libertarian and free-market economists, budget deficits are liable to cause significant economic problems – crowding …

Read more

Total UK Debt

  • When examining debt levels in the UK, there is government debt – measured by public sector borrowing (often referred to as National debt). See: UK National Debt.
  • We also have private sector debt which is composed of personal loans, personal mortgages, business debts, and debts of the financial sector.
  • You could say total Debt includes both private sector debt plus government debt. Though bear in mind, there is not an exact statistic and it could involve double counting. It is also not measured consistently
  • Private sector debt can be split up into
    • Household debt – personal loans
    • Non-Finance corporates – Company debts
    • Financial – debts of banks and financial corporations

Private Sector Debt

private-credit-non-finance

Credit to Private Sector


household-debt-%gdp

Fred – Household

Total Credit to Households

credit-financial-sector

Series discontinued after 2017

Government debt

uk-debt-93-25

  • Household + non-financial corporate debt (“private non-financial sector debt”) has in some years reached roughly 150% of GDP.

  • “Credit provided by the financial sector” (a proxy for financial-sector scale) has, historically, exceeded 200% of GDP during peaks.

  • Government gross/net debt has at times got close to 100% of GDP

This suggests total debt is around 450% of GDP but that would double-count many internal liabilities (e.g. inter-bank loans, bank deposits, corporate loans from banks, government debt held by financial institutions, etc.). So that “total” isn’t so meaningful

A meaningful “total debt of UK” would require:

  • Consolidation across sectors (households, corporates, government, financial institutions)
  • Excluding intracountry claims (to avoid double-counting)
  • Consistent definition: net vs gross, domestic vs foreign, debt vs liabilities vs credit

Overall, it is worth looking at both government and private sector debt, but to come up with a figure for total debt is hard in a meaningful sense.

Sectoral balances

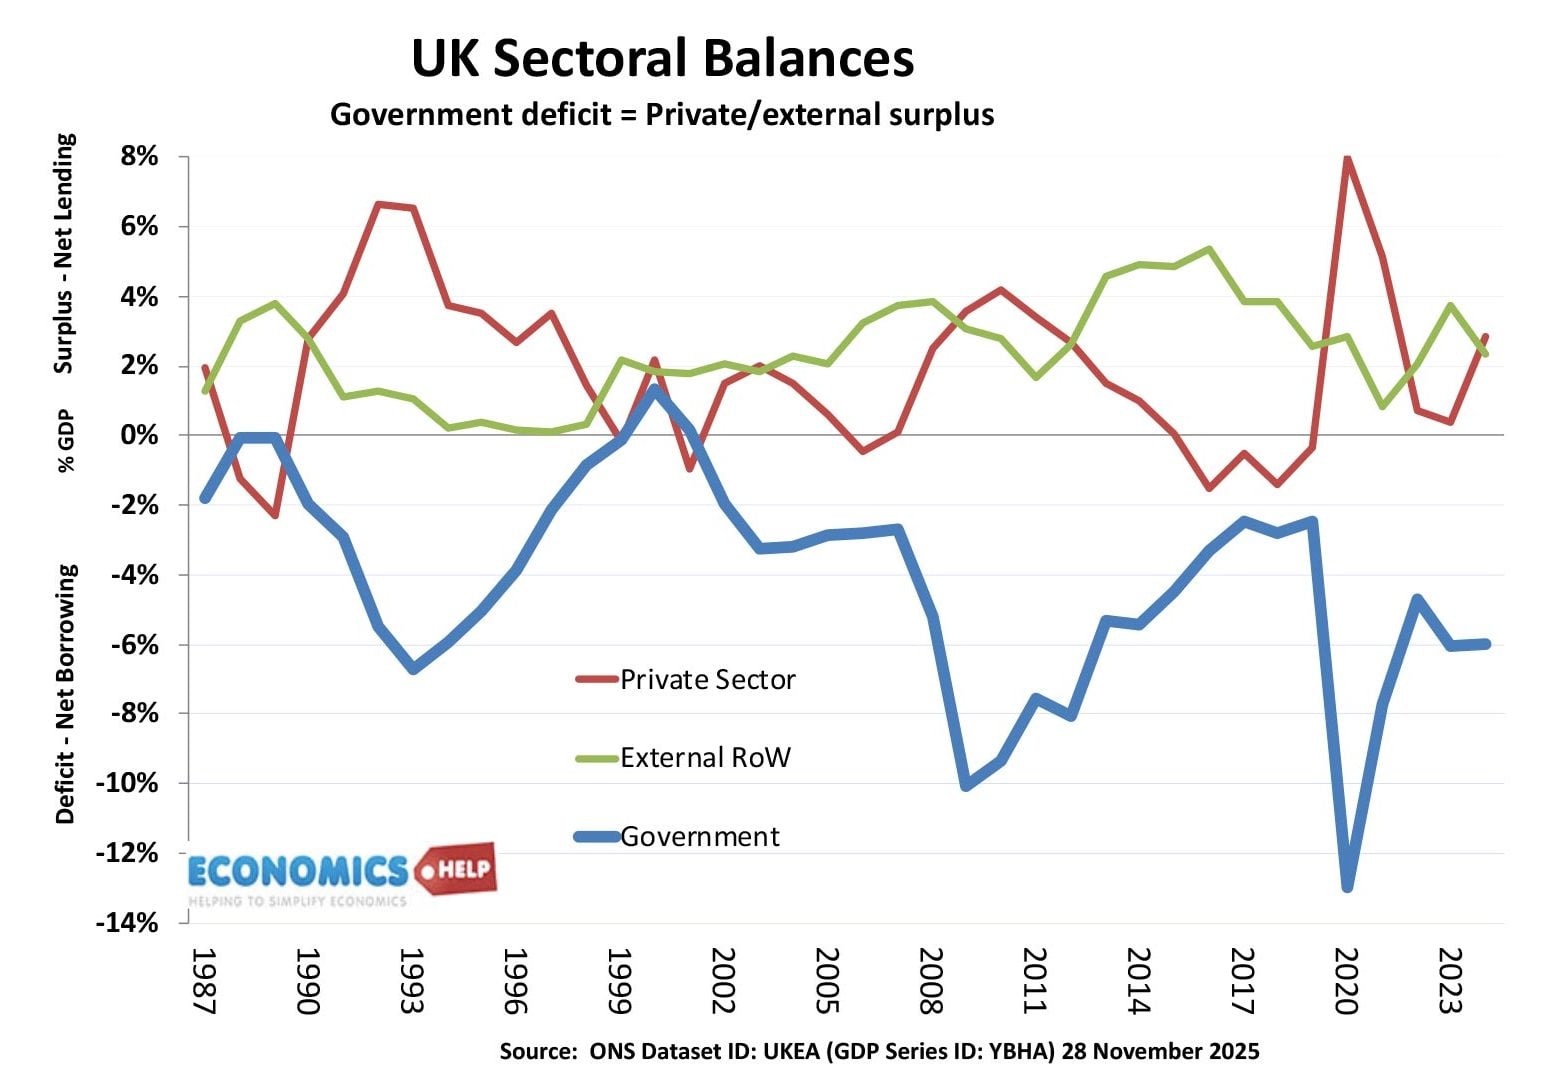
Another factor worth bearing in mind is link between government deficit and finance/overseas net surplus. If government borrows more, it borrows from private sector or overseas. So the private sector is lending to government, building up assets. Or foreigners are buying UK assets.
uk-sectoral-balances-2025


Archived from 2013

Total UK debt

total-uk-debt
total UK  Debt – Private + Public

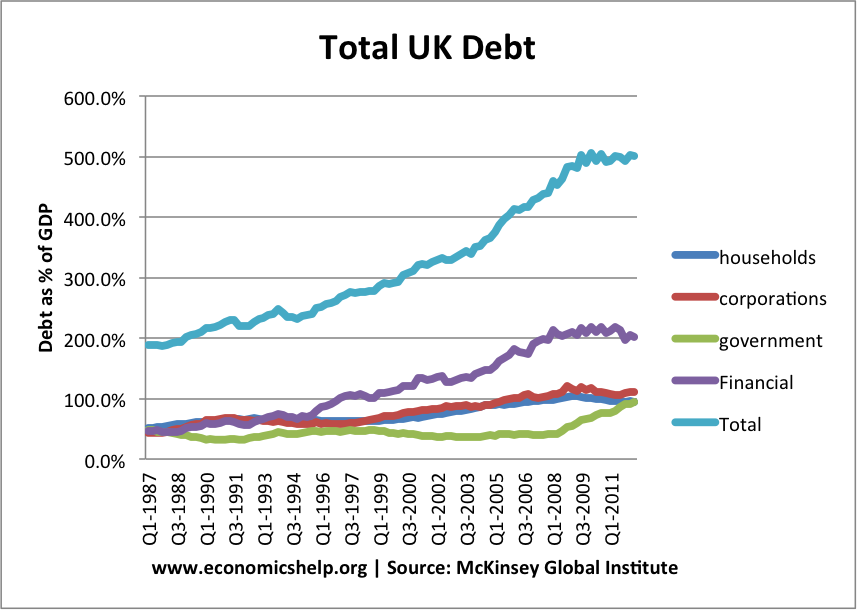
Total UK debt increased sharply in period 1994-2007.

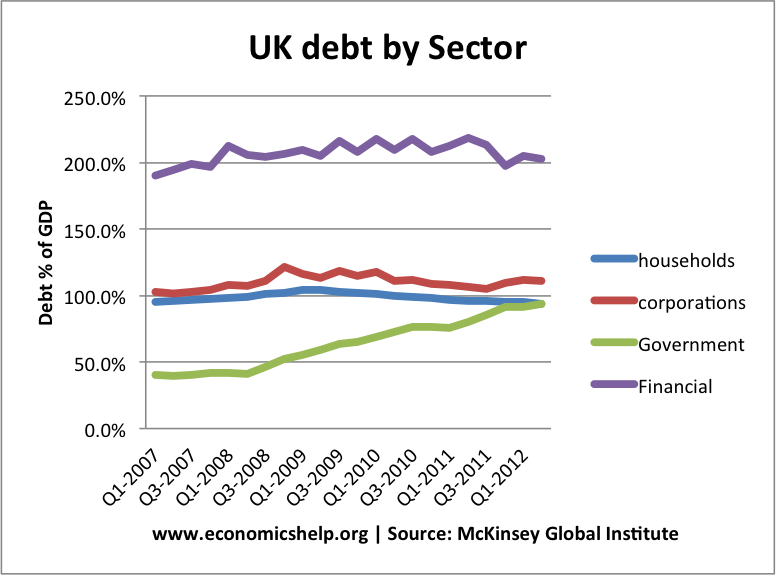
Since 2008, there has been a fall in household debt as a % of GDP – as households cut back debt levels. (note GDP also fell in this period)
debt-sector-2007

Financial sector debt has stayed constant at 200% of GDP.

Main Features

  • Total UK debt is 500% of GDP in mid 2012
  • The largest component of debt is from the financial sector.
  • The deleveraging is greater than may appear from the statistics. Although debt levels have remained flat, this is against the backdrop of falling real incomes.

Compare experience of US – where total debt fell in period 2009-12.

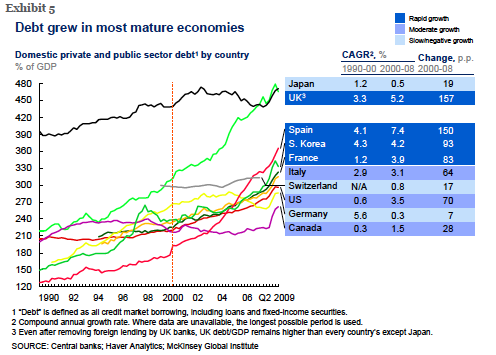
Overall Indebtedness in Developed Economies
Source: Debt and Deleveraging pdf at McKinsey

The UK has seen the biggest rise in total UK debt in past 20 years. Only Japan is slightly higher.
Read more

UK debt held by foreign investors

gilt-holdings-by-sector

One of the most common questions asked is, who owns UK National Debt?

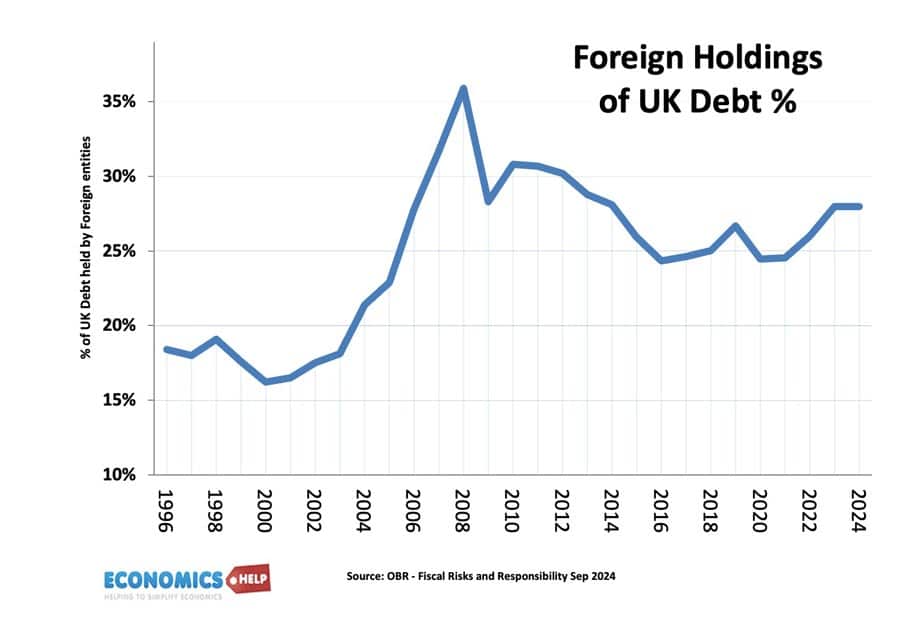
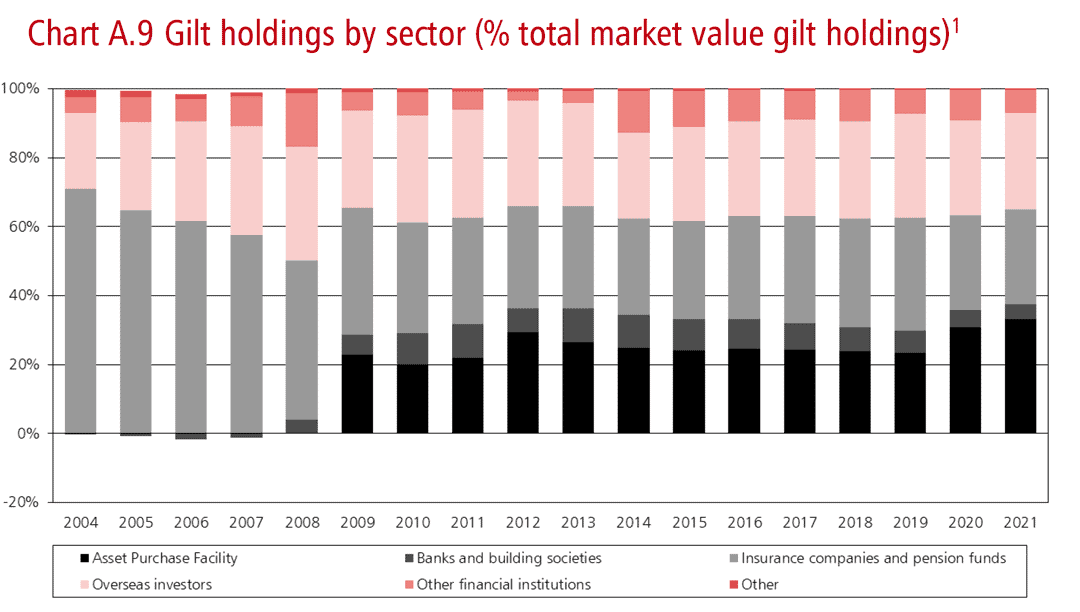
Often people assume that UK government debt is owned by foreign investors. However, foreign investors only hold about 25-30% of UK government debt. The rest is held by the UK private sector (pension funds, insurance companies e.t.c). Recently, the Bank of England has also been purchasing Gilts under the Asset Purchase Scheme.

In the past few years, the proportion of UK government debt held by overseas investors has been about 30%.


gilt-holdings-by-sector

Source: HM Treasury

For 2021, debt held by Overseas investors is 28% of GDP

The Asset Purchase Facility is purchases by the Bank of England as part of quantitive easing. This accounts for 26% of gilt holdings.

A different, but similar, concept is external debt. This is the total amount of UK debt (both private sector and public sector) held by overseas agents.

UK Debt Held By Overseas Investors 1996-2023

foreign-holdings-uk-debt-percent


Source: OBR | Blog who does the UK owe money to?

foreign-holdings-government-debt

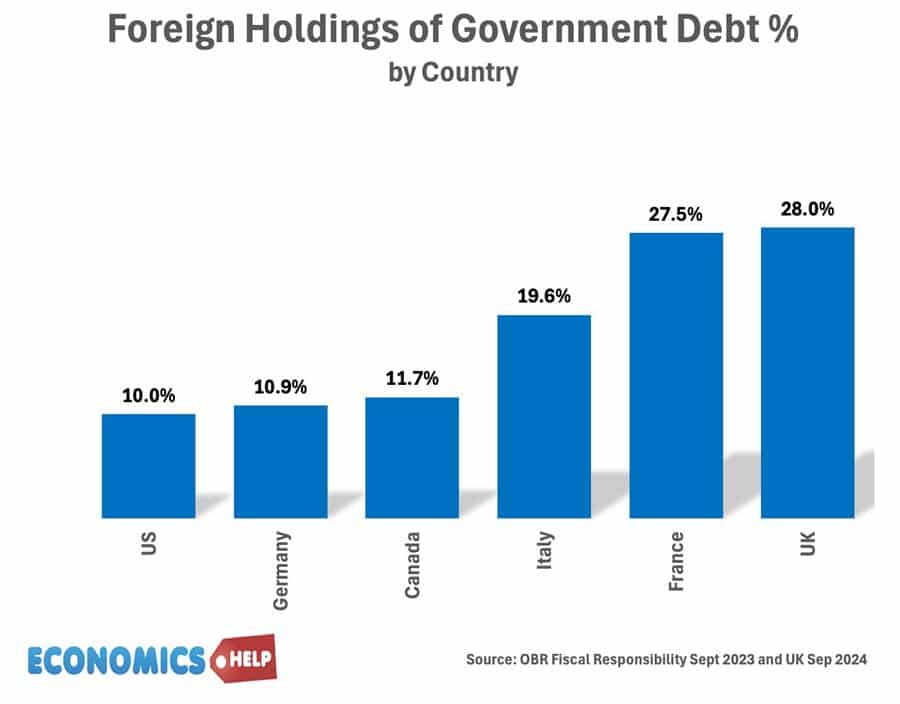
Foreign ownership of debt is relatively high in the UK

Read more

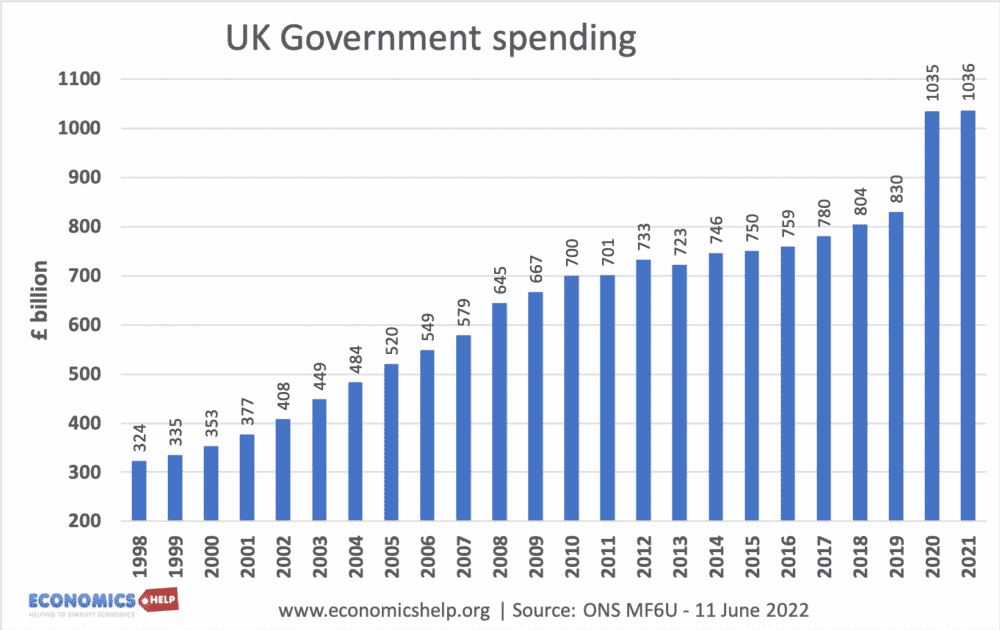
UK Government spending – real and as % of GDP

uk-public-spending-share-of-gdp-june-2022-crop

uk-government-spending-98-22

Source: ONS MF6U

UK government spending passed over £1 trillion in 2020 due to the extra spending measures of the Covid Pandemic.

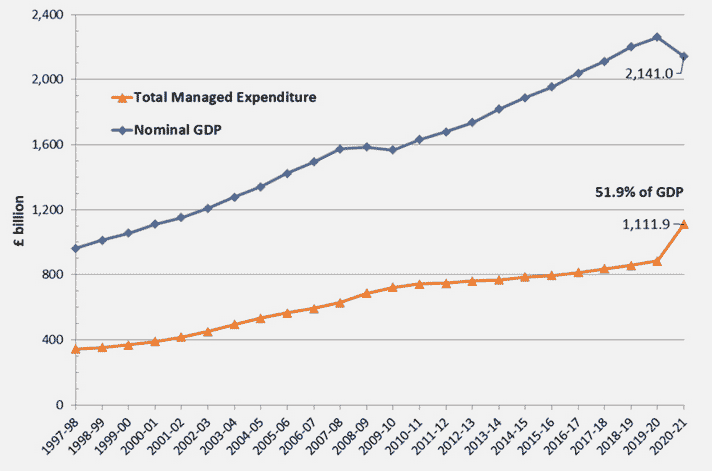
Total spending compared to Nominal GDP

total-government-spending-psr-gov-uk

Source: HMT public spending statistics (May 2022)

The rise in spending 2020-21, also combined with a fall in GDP

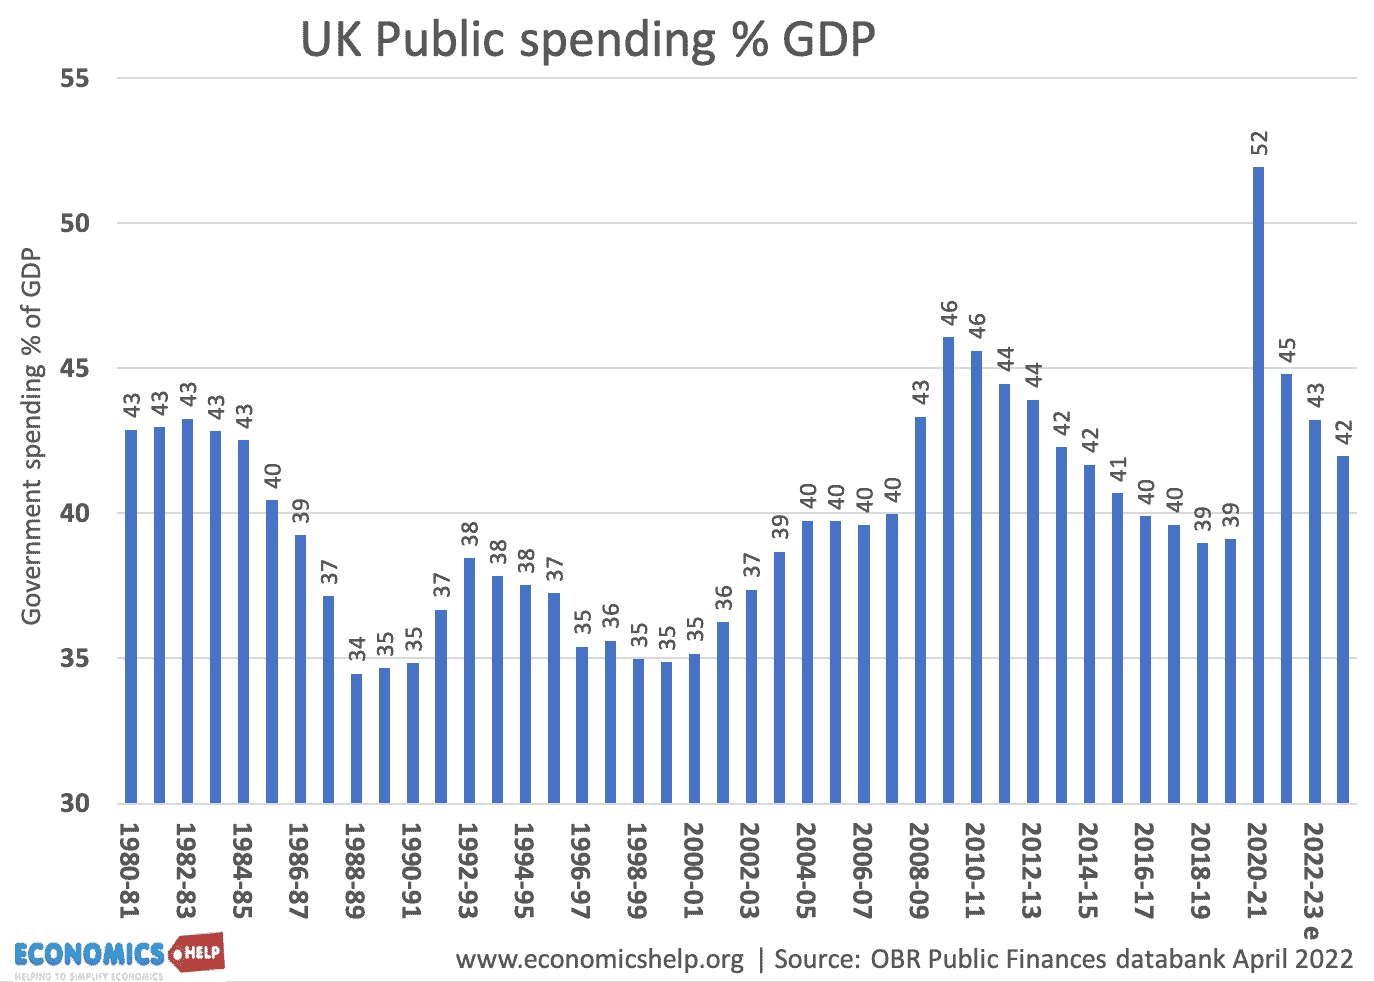
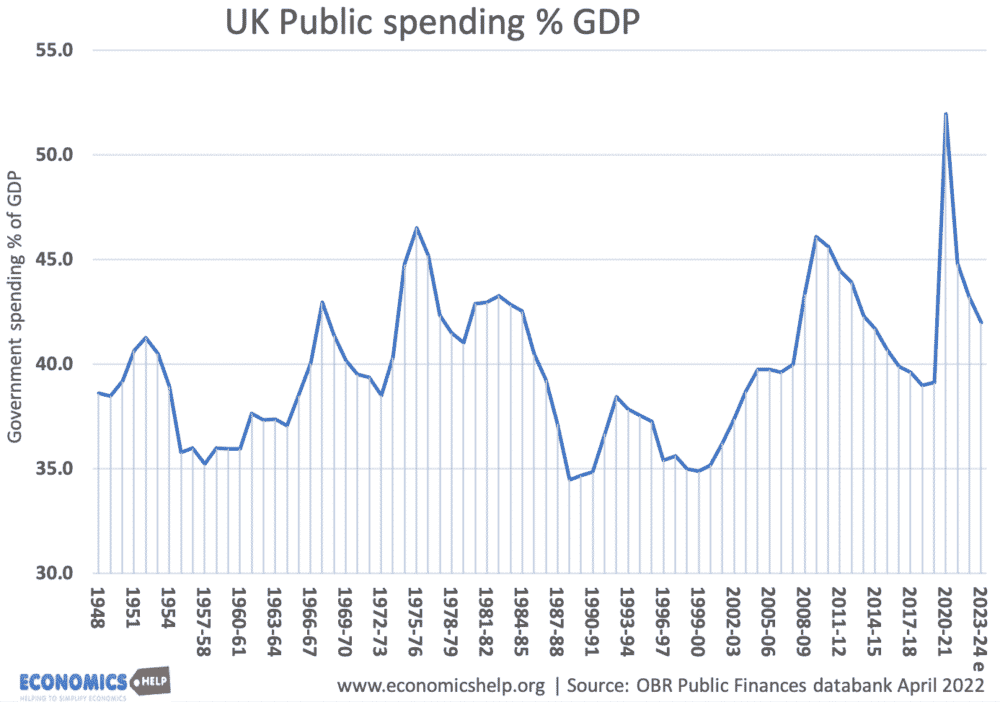
UK Public spending as % of GDP

https://www.gov.uk/government/statistics/public-spending-statistics-release-may-2022/public-spending-statistics-may-2022

Source: OBR (April 2022)

In 2000-01, several years of government spending restraint combined with rising economic growth, saw government spending shrink to under 35% of GDP. Between 2001 and 2007-08, spending rose to over 40% of GDP due to sustained increases in spending on health, education and welfare spending.

In 2007/08 the financial crisis and subsequent recession led to higher spending as ratio of GDP – even though the new Conservative government pursued austerity and sought to cut government spending or limit spending in many areas.

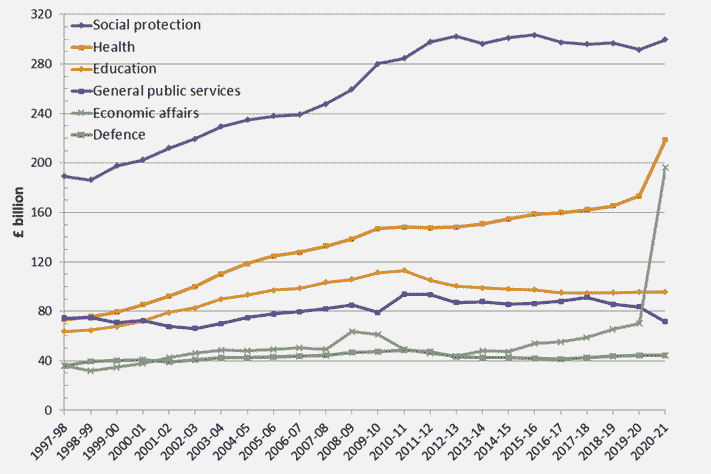
Real term trends in public spending

spending-by-dept-psr-gov-uk

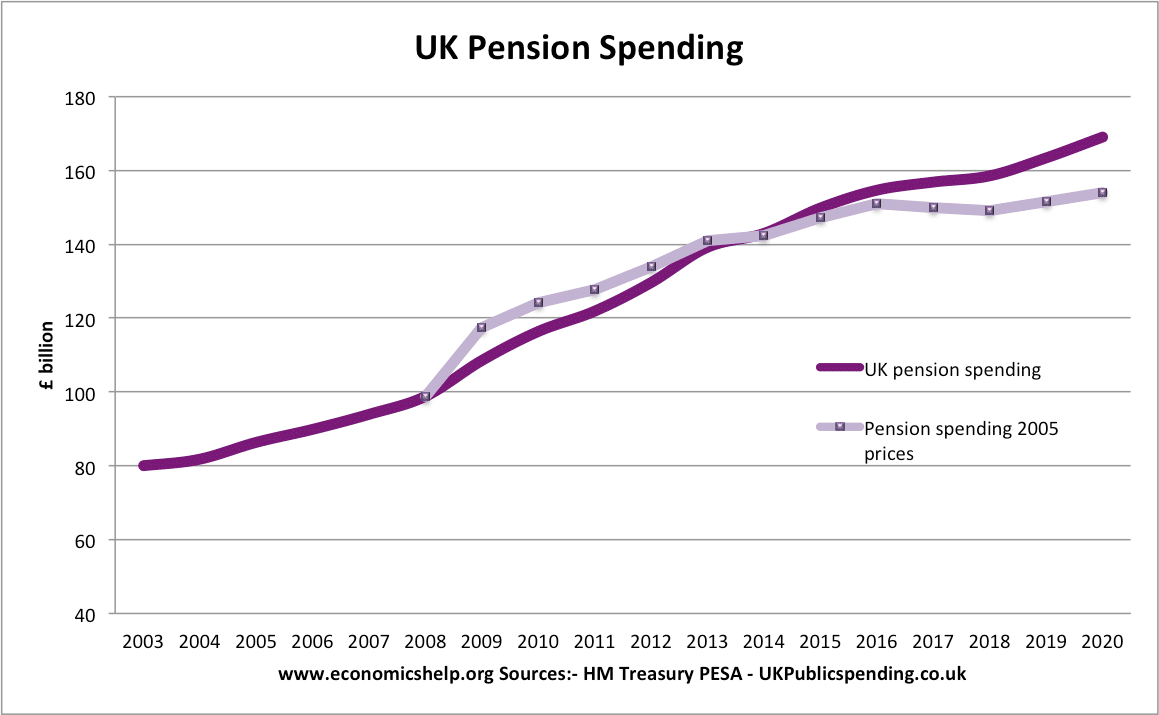
Health care has been the biggest source of growth since 2010. Social protection, which includes pensions has been flatter since 2010 because of low real income increases in welfare benefits.

Source HMT Public spending statistics (May 2022)   UK Pension spending

More details on pension spending.

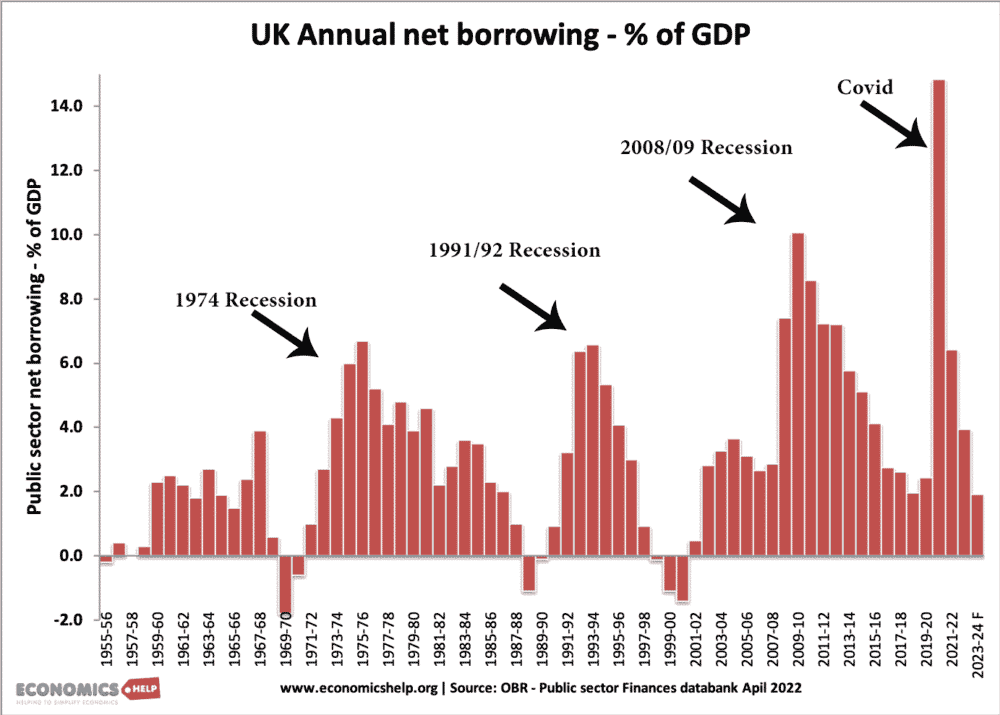
Government borrowing

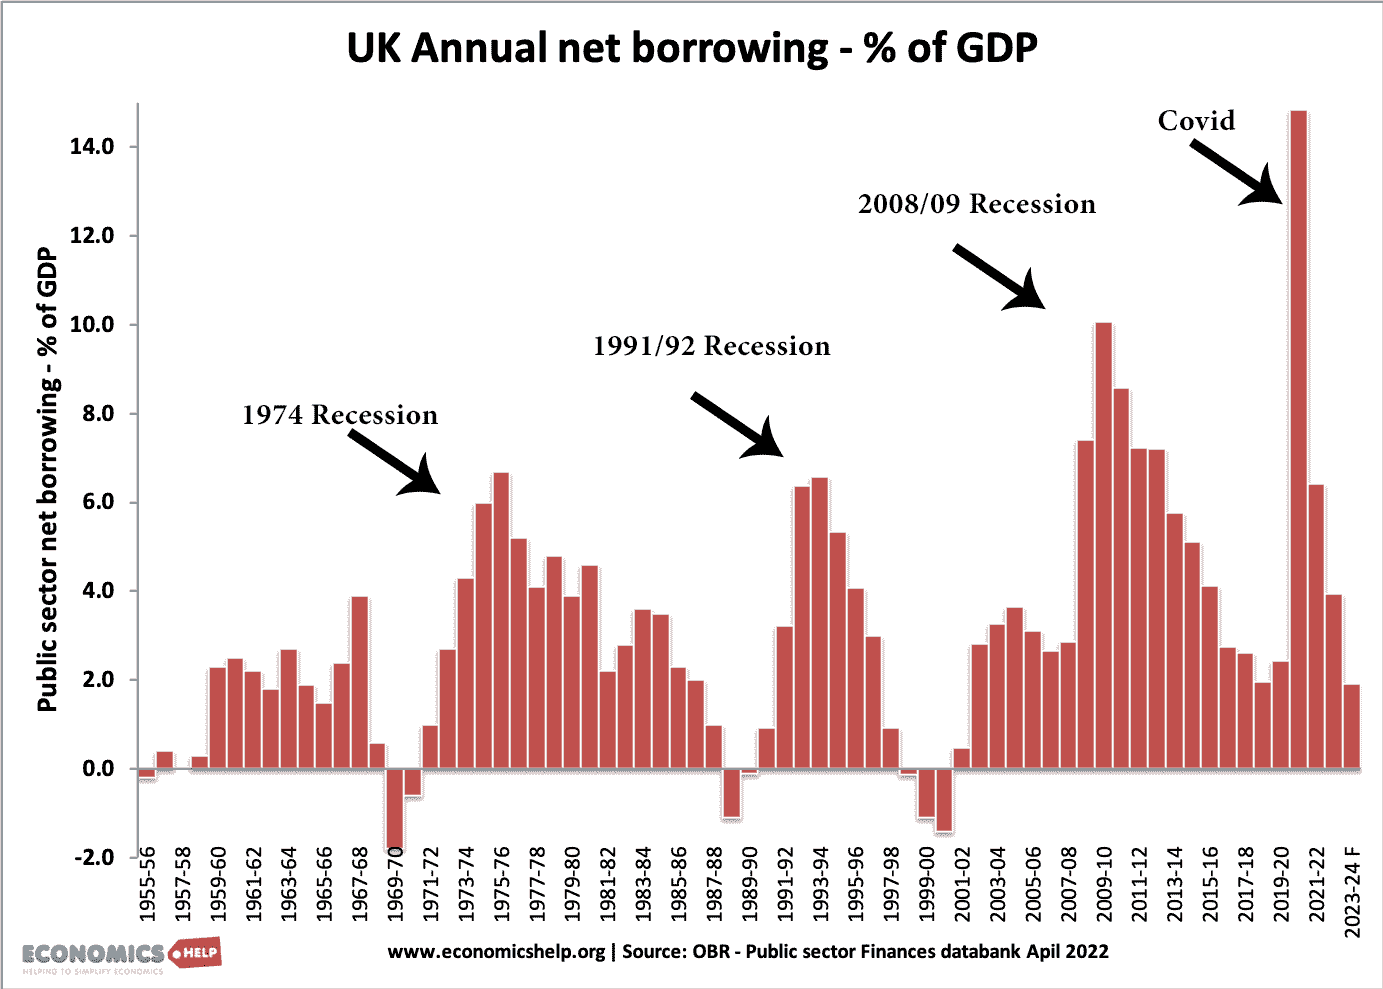
uk-net-borrowing-55-22-marks

This shows recent government borrowing. As expected in a recession, borrowing peaks.

Background to government spending

  • Between 2008-09 and 2009-10, the UK saw a large drop in real GDP of 6%, but due to automatic stabilisers government spending increased (e.g. higher unemployment benefits). This caused government spending as % of GDP to rise to 47%.
  • Government spending as % of GDP is forecast to fall closer to 40% of GDP by 2016-17 (if growth targets are met)

Read more

Does higher debt lead to higher interest rates?

Is there a link between government debt and the interest rate on government bonds? One argument we often hear is that if government borrowing increases – we can expect higher bond yields. Investors demand higher yields to compensate for the risk of government default. However, other economists argue this is misleading. If inflation is low, …

Read more

Government debt under labour 1997-2010

Government debt under Labour was a major factor in the elections of 2010 and 2015. But to what extent did the Labour government really plunge the economy into debt during 1997-2007?

Usually, when people say ‘it’s debt that got us into this mess’. They tend to view all types of debt as the same – equating government debt to financial debt incurred from selling sub-prime mortgages in the US. However, this is deeply misleading. The consequence of bad debt defaults in the financial system is very different to government debt financed through selling bonds.

Government debt

debt-under-labour

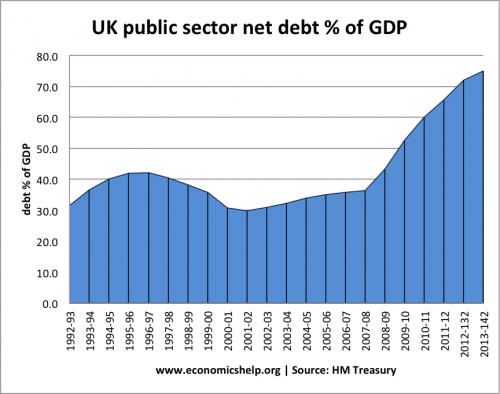
In 1997, public sector debt as % of GDP:

  • 1997/98 – 40.4% of GDP
  • 2007/08 – 36.4% of GDP
  • 2010/11 – 60.0% of GDP.
  • May 2019 – 82.9% of GDP

At the start of the great recession in 2007, public sector debt had fallen from 40.4% of GDP to 36.4% of GDP. This was despite increased real government spending. After the start of the crisis, public sector debt almost doubled in the space of three years.

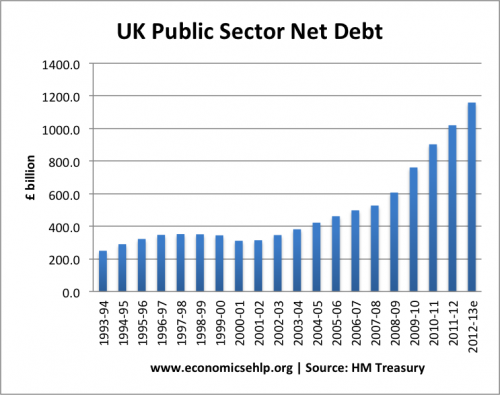
If we look at just actual government debt, there is a significant increase.

In 1997, the total public sector debt was:

  • 1997/98 – £352 bn
  • 2007/08 – £527 bn
  • 2010/11 – £902 bn

public-sector-debt-total-hmT

Debt to GDP statistics were helped by the period of strong economic growth – a reminder that economic growth is as important at debt levels. It is also worth bearing in mind UK public sector debt in comparison to the post-war period.

Read more

Does Government Debt Matter?

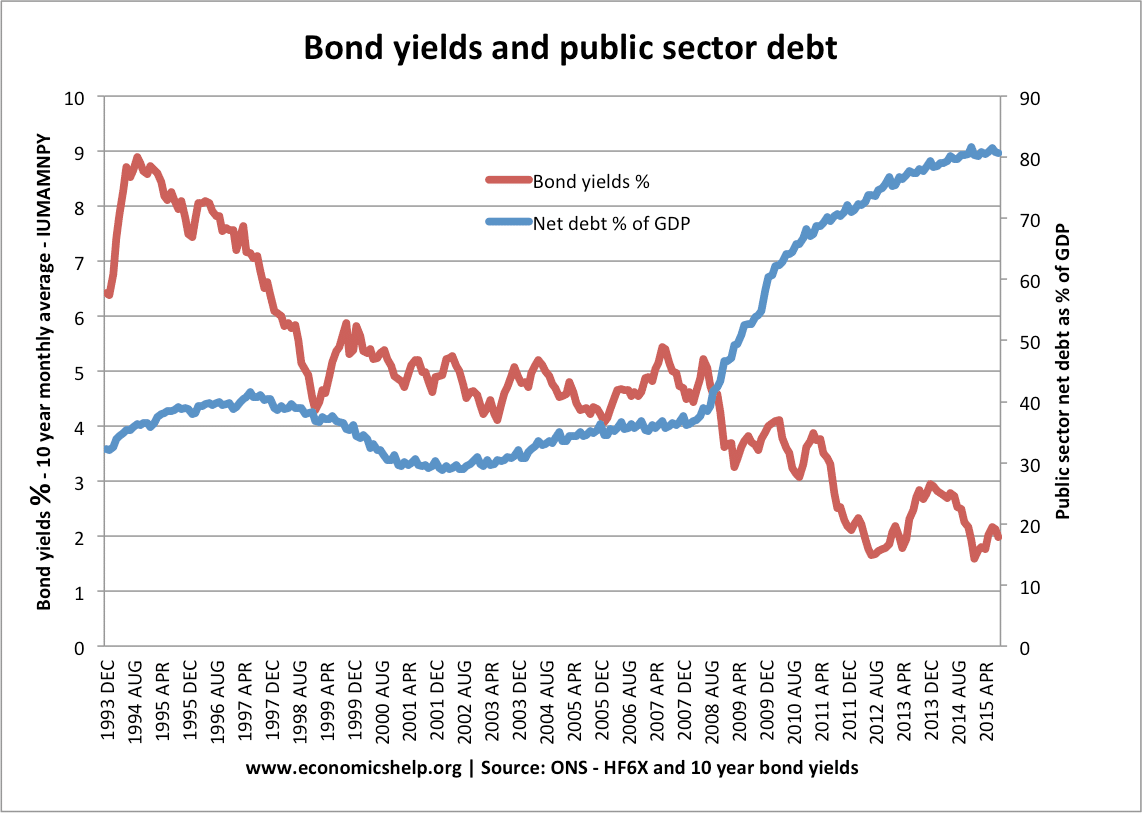
bond-yields-net-debt

Readers Question: Does Government debt matter? Do high fiscal deficits threaten economic stability?

Summary

Many worry that high levels of government debt could cause economic instability. In certain occasions, countries with high debt have seen investors lose confidence, leading to higher bond yields and putting pressure on the government to slash spending, for example, several countries in the Eurozone (2010-12). In rare cases, governments with high debt have responded by printing money – causing inflation to spiral out of control, for example, Germany in the 1920s. Another potential problem is when government debt is financed by overseas borrowing. If overseas investors lose confidence and sell their debt it can cause a loss of foreign exchange and a destabilising devaluation.

However, in many cases, high levels of government debt do not cause instability – but can actually prevent a deeper recession. The main argument for government borrowing is that in a recession, government borrowing and government spending can help prevent a collapse in demand and economic growth. In a recession, generally, people save more and so wish to buy government debt. This means governments can often borrow cheaply to finance public sector works.

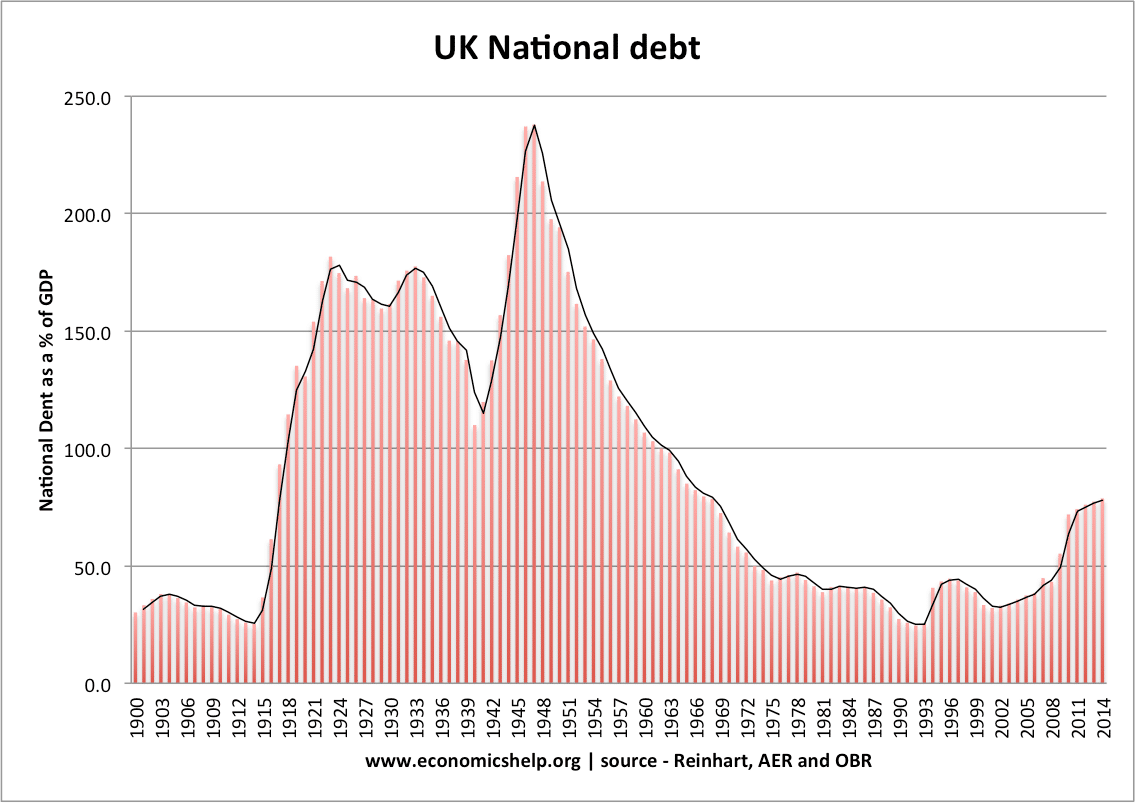
uk-national-debt

In the 1950s, national debt in the UK reached 200% of GDP, but it did not compromise economic growth or inflation. The UK was able to reduce this debt burden over several decades of economic growth.

Does debt matter?

  • It depends on how it is financed – e.g. does it rely on overseas borrowing which can be riskier?
  • What are the prospects for economic growth? – With economic growth, the debt to GDP ratio is likely to fall. If you are stuck in recession, the debt to GDP ratio will likely rise.
  • Are domestic investors willing to buy government bonds? Japan has very large public sector debt, but it has a large pool of domestic savings so the government has been able to borrow cheaply.
  • Is the debt cyclical or structural? Debt is a bigger problem if the government is borrowing heavily during a period of growth and there is a structural deficit.

More detail on question

Economic stability would involve.

  • Low inflation
  • Positive, sustainable economic growth (e.g. close to long-run trend rate of growth)
  • Stable bond yields (i.e. avoid rapidly rising bond yields which could create difficulty in dealing with debt.)
  • Stable exchange rates

High fiscal deficits mean the government is forced to borrow a large sum – Annual government spending is greater than tax revenues.

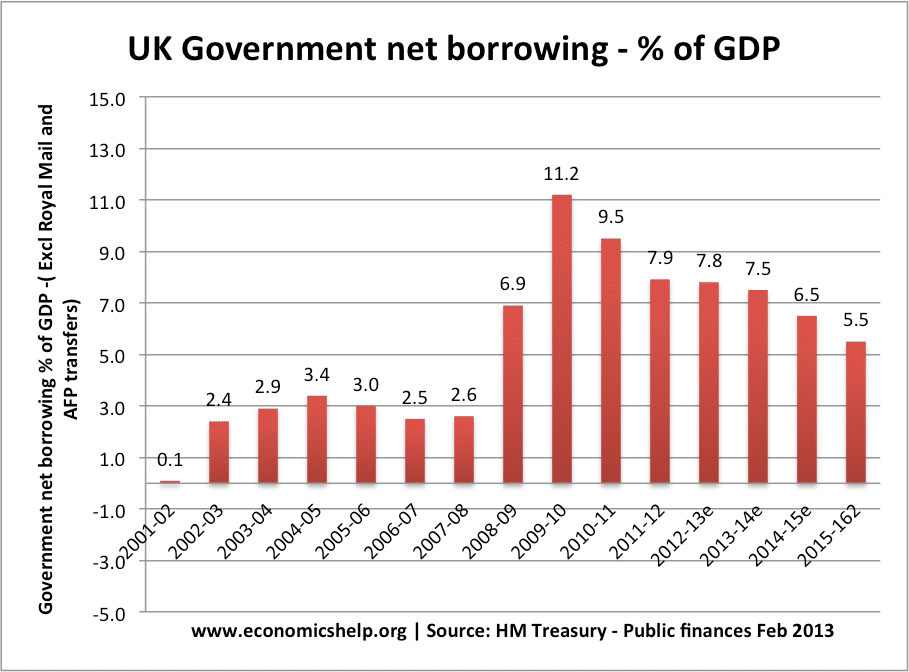
For example, in 2011/12 the UK government will have to borrow an estimated £125bn (just under 8% of GDP). Anything over 3% of GDP could be classed as a high fiscal deficit.

borrowing-percent-gdp-exclude-royal-mail

Read more

Item added to cart.
0 items - £0.00