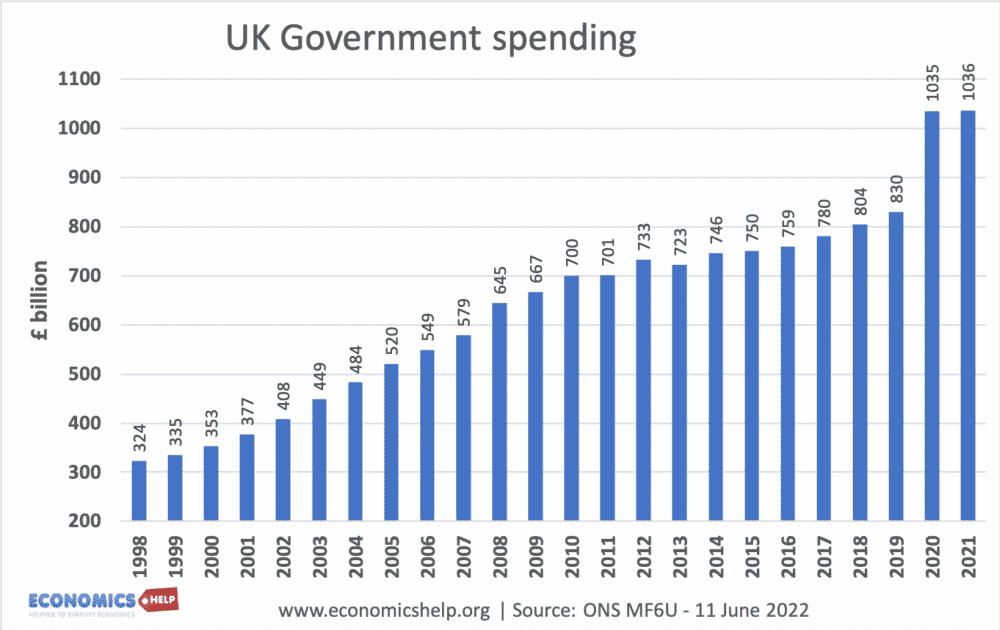
Source: ONS MF6U
UK government spending passed over £1 trillion in 2020 due to the extra spending measures of the Covid Pandemic.
Total spending compared to Nominal GDP
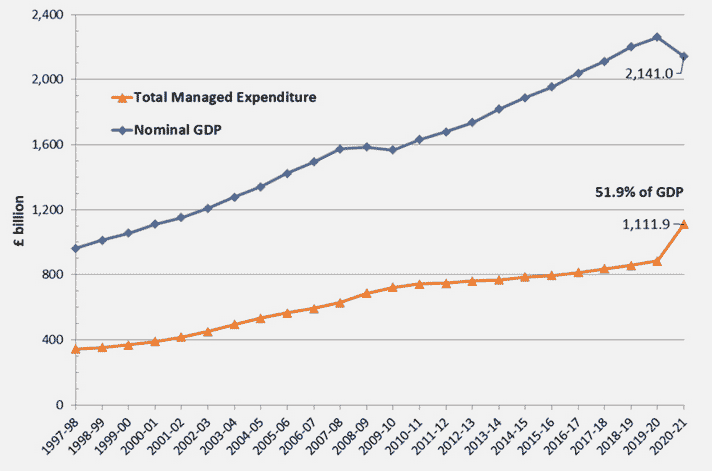
Source: HMT public spending statistics (May 2022)
The rise in spending 2020-21, also combined with a fall in GDP
UK Public spending as % of GDP
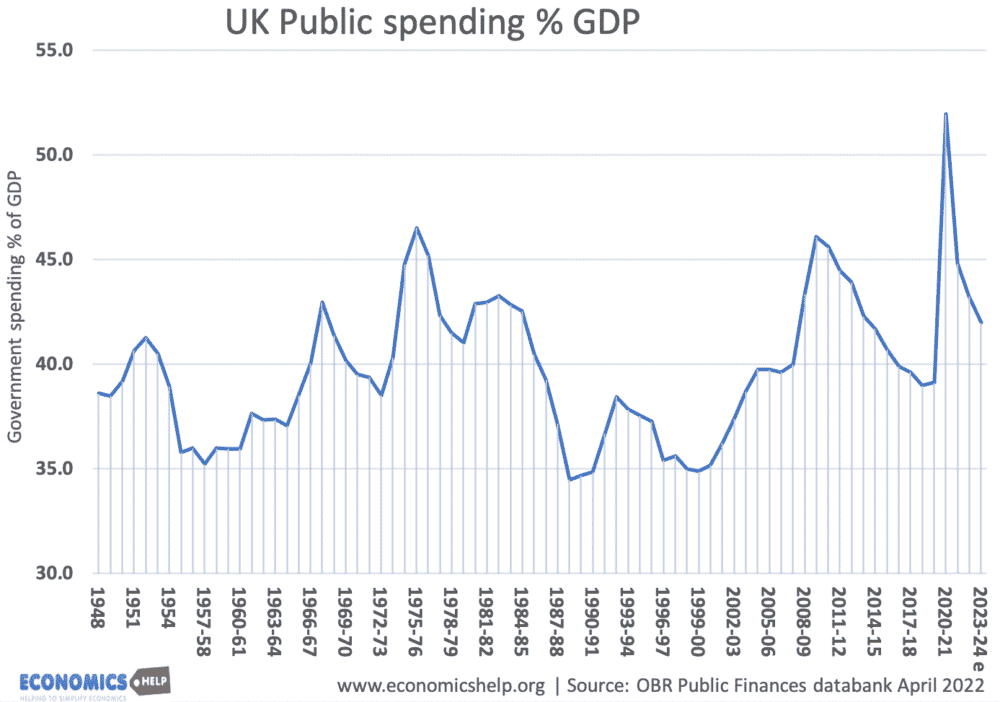
Source: OBR (April 2022)
In 2000-01, several years of government spending restraint combined with rising economic growth, saw government spending shrink to under 35% of GDP. Between 2001 and 2007-08, spending rose to over 40% of GDP due to sustained increases in spending on health, education and welfare spending.
In 2007/08 the financial crisis and subsequent recession led to higher spending as ratio of GDP – even though the new Conservative government pursued austerity and sought to cut government spending or limit spending in many areas.
Real term trends in public spending
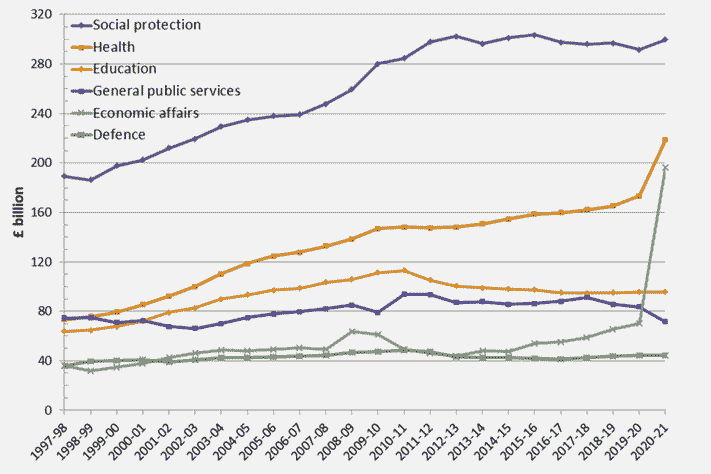
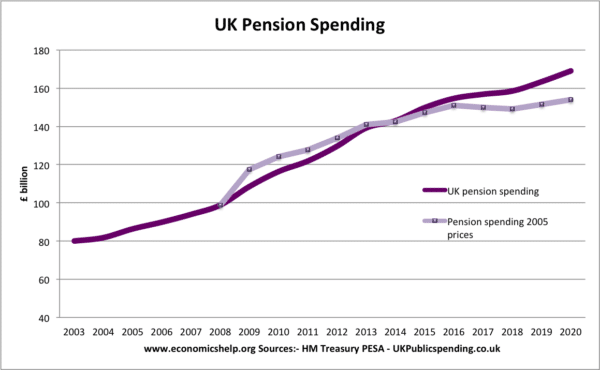
Health care has been the biggest source of growth since 2010. Social protection, which includes pensions has been flatter since 2010 because of low real income increases in welfare benefits.
Source HMT Public spending statistics (May 2022) UK Pension spending
More details on pension spending.
Government borrowing
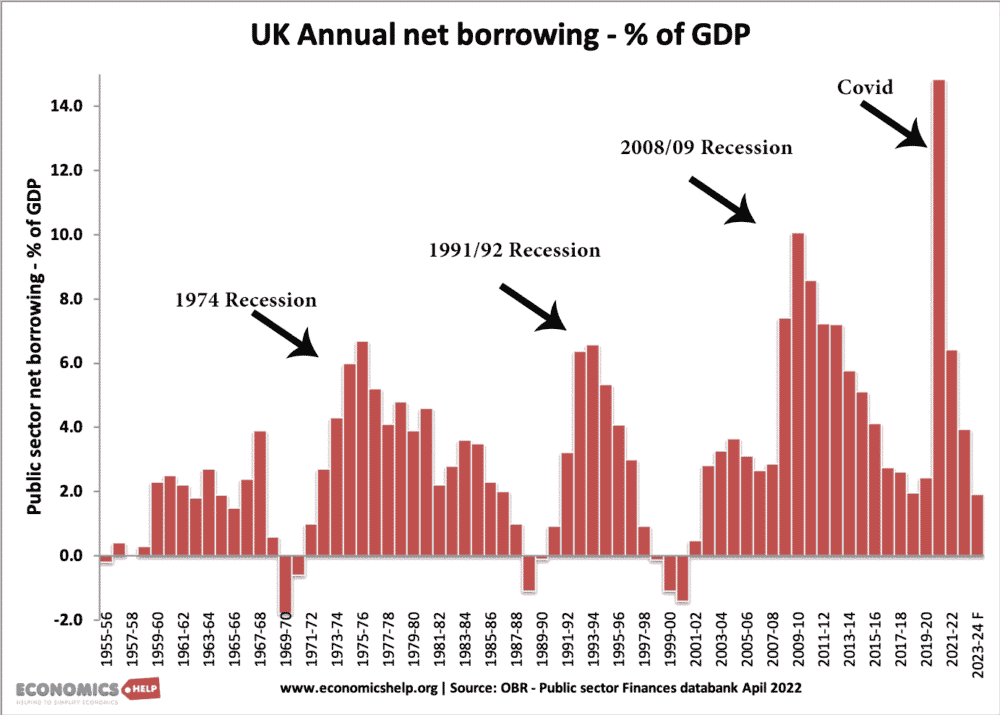
This shows recent government borrowing. As expected in a recession, borrowing peaks.
- More on Government net borrowing here
Background to government spending
- Between 2008-09 and 2009-10, the UK saw a large drop in real GDP of 6%, but due to automatic stabilisers government spending increased (e.g. higher unemployment benefits). This caused government spending as % of GDP to rise to 47%.
- Government spending as % of GDP is forecast to fall closer to 40% of GDP by 2016-17 (if growth targets are met)
Government spending by department

UK government spending as % of GDP since 1900
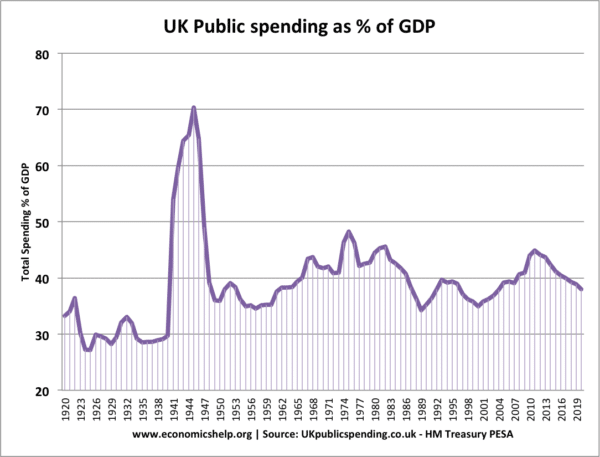
- Between the late 1940s and 2000, government spending as a % of GDP has stayed around 40%.
- But, actual real government spending triples from £100bn to £300bn
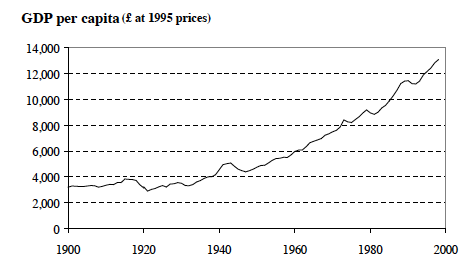
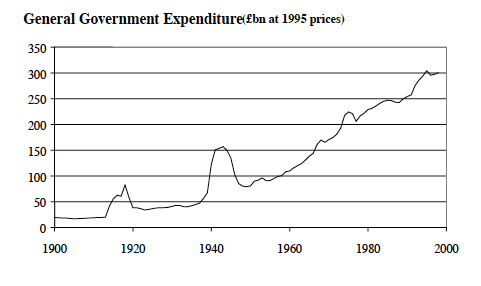 Government spending in real terms
(at 1995 prices means the actual spending is adjusted for inflation since 1995.
This is due to an increase in GDP. A similar tripling of real GDP from £4,000 per capita to over £12,000
What does the Government spend its money on?
See posts on:
Further reading – What does the government spend its money on
Related issues Government Taxes
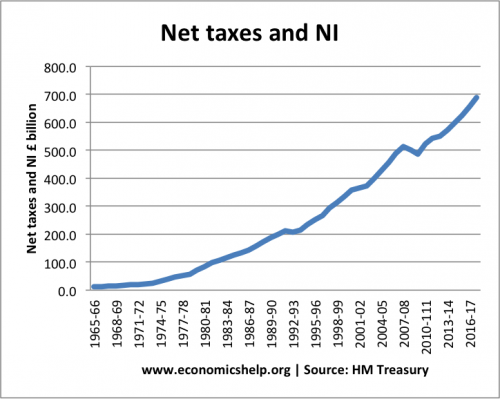
Government taxes as % of GDP
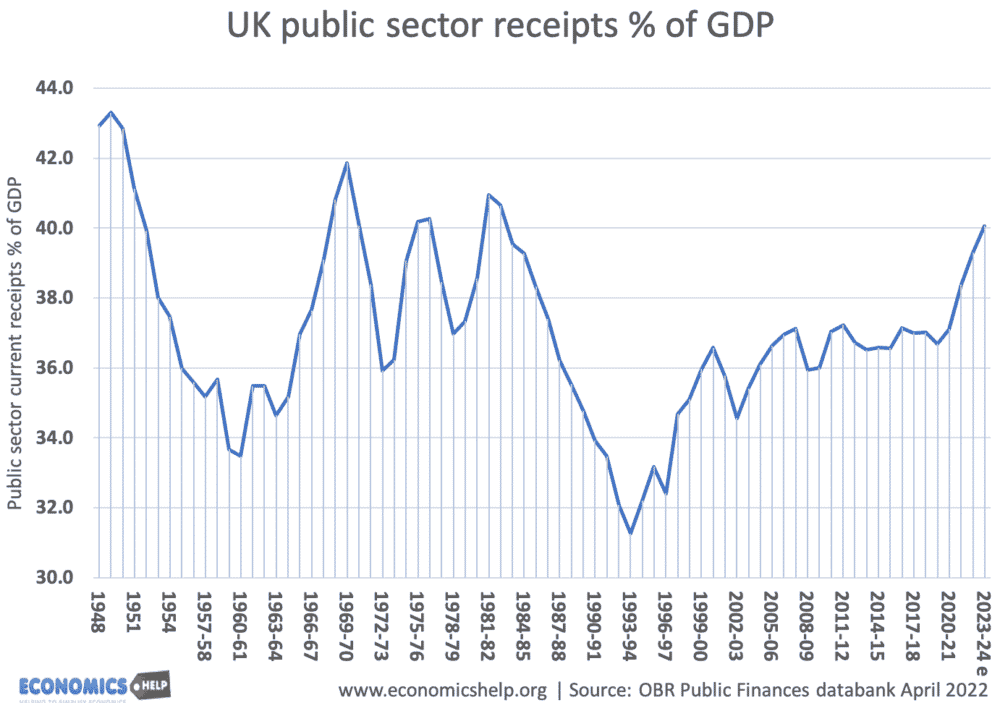
It is worth noting that net public sector receipts in 2011-12 were 36.9% of GDP – This is higher than total tax revenue of 35%. This is because the government can receive income from the proceeds of privatisation or selling mobile phone licenses.
Public sector debt
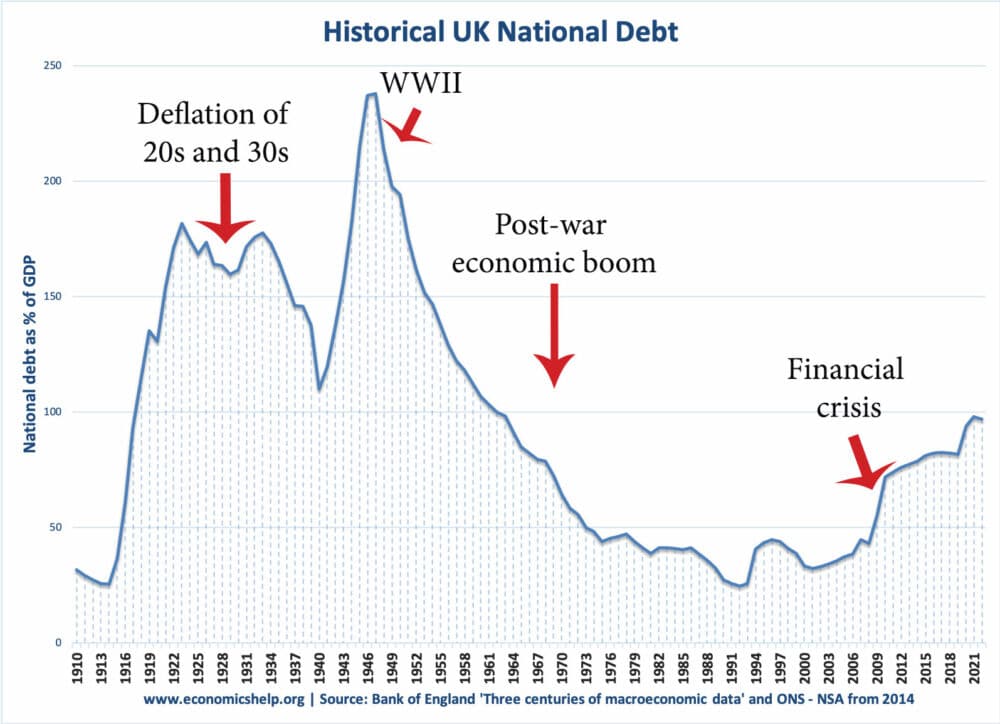
Public sector debt – nominal – more at UK National debt
Source of Data on government spending
- HM Treasury Public Finance database
Related Posts

Just a shame that ‘GDP’ as released, can no longer be relied upon to be representative of reality.
Real shame.
can anyone tell me what percentage of UK assets were state controlled by 1979 in terms of GDP, or other indicators?