A quick look at benefit spending in the UK. This is a follow up to Social security spending. Thanks to HM Treasury for help in finding useful data set.
Source: Public Expenditure Statistical Analysis 2014 | Data Chapter 5 – 5.2
Social Protection spending
Firstly, there has been a modification to the category of government spending, now labelled – ‘Social protection spending’ – See: Social protection spending. This is not just welfare benefits. It includes personal social services, e.g paying for nursing, care in the community; (spending which could perhaps be better included with health care).
Secondly, by far the biggest level of social protection spending is pension spending. This includes both state pension payments and (I believe) state occupational pensions to retired public sector workers.
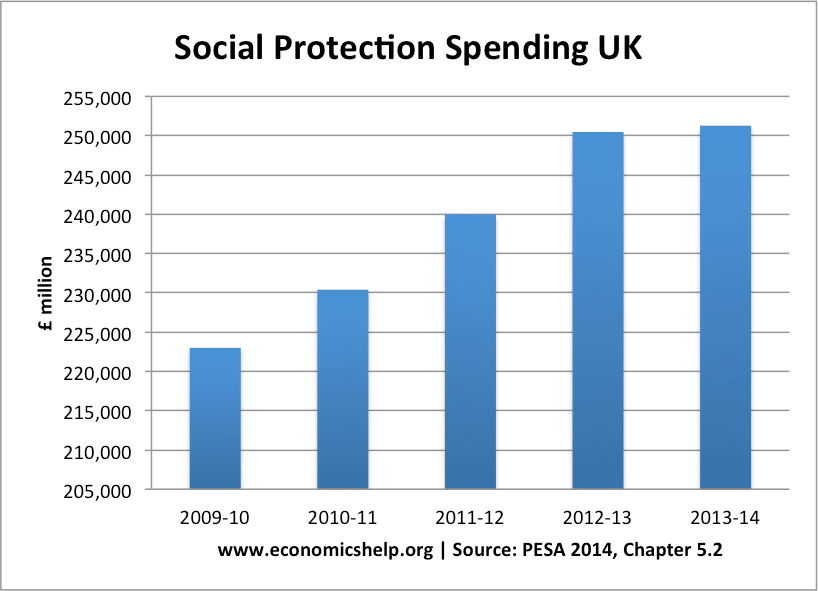
It is a very unwieldy sub-division of government spending, but if we look at whole budget it increased significantly during the great recession 2009-2013. This is partly due to the cyclical higher welfare payments expected during a period of unemployment and low income growth.
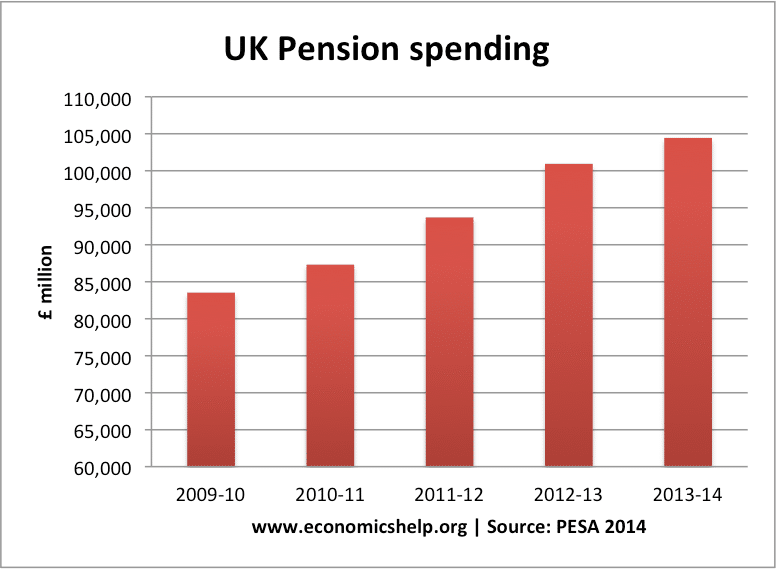
However, on closer examination, by far the biggest increase in spending from the social security budget is from pensions. Pension spending increased from £83bn in 2009/10 to £104.4 bn in 2013/14. An increase of £21 bn. In a period of so called austerity, that is a big increase in government spending.
- Unemployment benefit payments fell in this period from £5.5 bn to £4.9 bn
- Sickness and disability benefits rose from £30.6 bn to £37.5 bn
- Income support, tax credit (both family and social exclusion) declined from (£45.8bn) to £ 43.9 bn)
- Housing benefit from £22bn to £26bn (see: more on Housing benefit)
UK Pension spending
Benefit spending in the UK
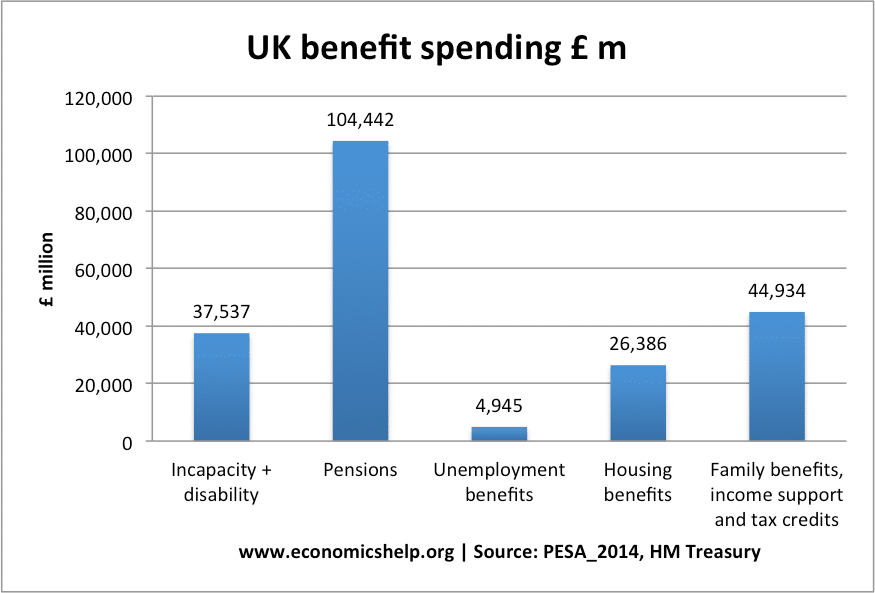
According to PESA there are five main groups of benefit spending
- Incapacity, disability and injury benefits.
- Pension spending
- Unemployment benefits
- Housing – I assume this is mainly housing benefit and rent rebate, though it doesn’t explicitly say.
- Family benefits, income support and tax credit.
The HM Treasury actually split ‘income support benefits’ into two different groups.
They have sections for:
10.4 Family and Children (£24bn)
– Income support, tax credits
10.7 Social exclusion (£29bn)
– Income support, tax credits
I’m not entirely sure of the distinction. It doesn’t seem the most helpful breakdown of where the benefits actually go.
Breakdown of welfare spending by OBR
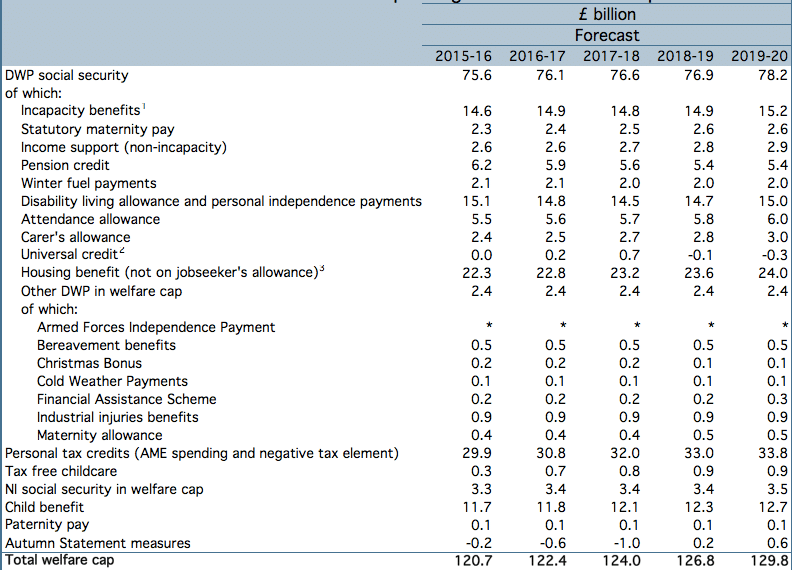
Source: OBR – Economic and Fiscal Outlook, fiscal supplementary tables, Dec. 2014
Benefit spending by income decile

- The poorest 10% receive less pensions (suggesting the poorest 10% less likely to be over 65), but of working age.
- They also receive less tax credits (the poorest 10% are less likely to be working so don’t benefit from top of benefits for low wages). The biggest recipients of tax credit are the third decile who receive on average £1,677. compared to just £778 for the bottom 10%
- See more: at benefits by income decile
Growth of welfare spending in the UK
The best definition of welfare spending would exclude universal state pensions and state occupational payments. It would also exclude the social personal services – which are not benefits but an extension of health care / social care.
Welfare payments imply a degree of means-testing to give benefits to people who are unemployed, low income, disabled or struggling to deal with high living costs. A more useful sub-section of government spending would be to include all the welfare benefits which are designed to reduce inequality
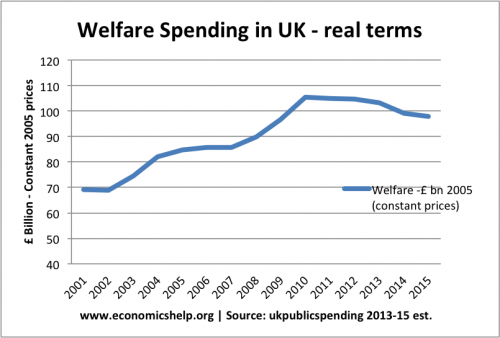
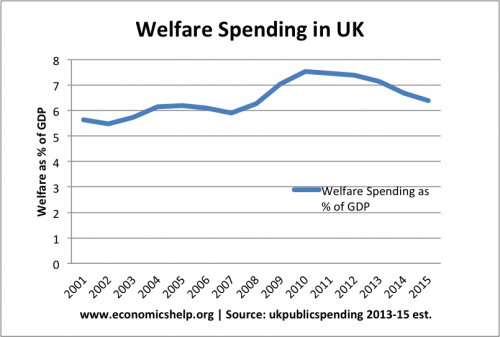
Also, very important to consider welfare spending as a % of GDP
Conclusions
You have to work hard to unpick government statistics. Given the political interest around welfare benefits. I would like to see clearer statistics making easier to find spending on the different types of welfare payments.
Also, we learn the biggest strain on government spending in the past few years is not coming from unemployment benefits and income support – but state pensions.
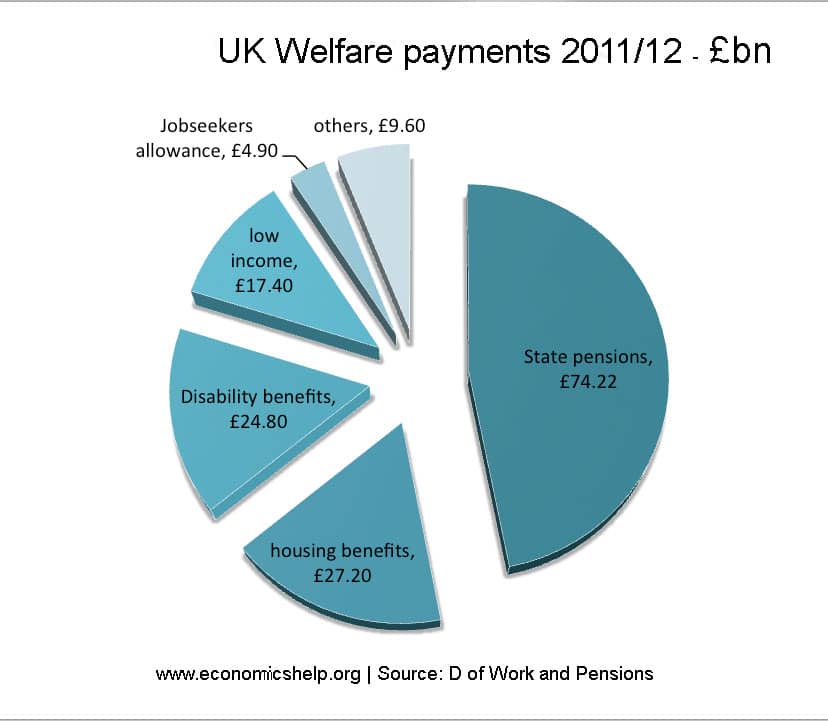
This is how it compared in 2011/12
Related pages
I could be wrong but I thought the pensions slice of welfare spending in Source D (DWP) is for specifically public sector pensions like police, nurses, and other civil servants etc… it’s not OAP type state pensions. I believe that’s in another part of the budget (https://www.economicshelp.org/wp-content/uploads/2014/11/UK-Spending-breakdown-600×432.jpg). Not your error just another way it’s misrepresented by the graphics.
Yes, thanks Steve. It is hard to unpick