
Readers Question: What does the Government spend its money on?
The government spends money for a variety of reasons:
- Reduce inequality (welfare payments like unemployment benefit).
- Provide public goods (fire, police, national defence)
- Provide important public services like education and health (merit goods)
- Debt interest payments.
- Transport
- Military spending
UK public sector spending 2023-24

In the UK, the biggest department for public money is social security. This takes almost a quarter of all public spending. It goes on financing a variety of benefits (State pensions, public sector pensions, housing benefits, income support, disability/incapacity benefits, unemployment benefits).
EU spending is £14.7bn (2014). Net spending £9.9bn. See more at the cost of EU
See also: Public Spending at UK Gov
Main areas of Government Spending 2015
- Public Pensions £150 billion
- Sickness and disability £40bn
- Old age pensions £107bn
- National Health Care + £133 billion
- State Education + £90 billion
- Secondary education – £25bn
- University education – £11bn
- local education spending – £48bn
- Defence + £46 billion
- Social Security + £110 billion
- State Protection + £30 billion
- Transport + £20 billion
- Railway – £5.2bn
- Roads – £3bn
- Local transport – £9bn
- General Government + £14 billion
- Executive and legislative – £5.9bn
- Other Public Services + £86 billion
- Social housing – £1.2bn
- Waste management – £9bn
- Public Sector Interest + £52 billion
Cost of EU
- Gross payment to EU – £17.2bn
- Net payment to EU – £8.6bn
- FT – EU cost
Total Spending = £731 billion
- Source: UK Public Spending
Other Notes
- Foreign Aid £7.8 billion or 0.7% of GDP 2011/12 (Cost of Foreign aid)
- Job Seekers allowance £4.9bn (or 0.7% of total spending) 2013/14
The largest area of government spending?
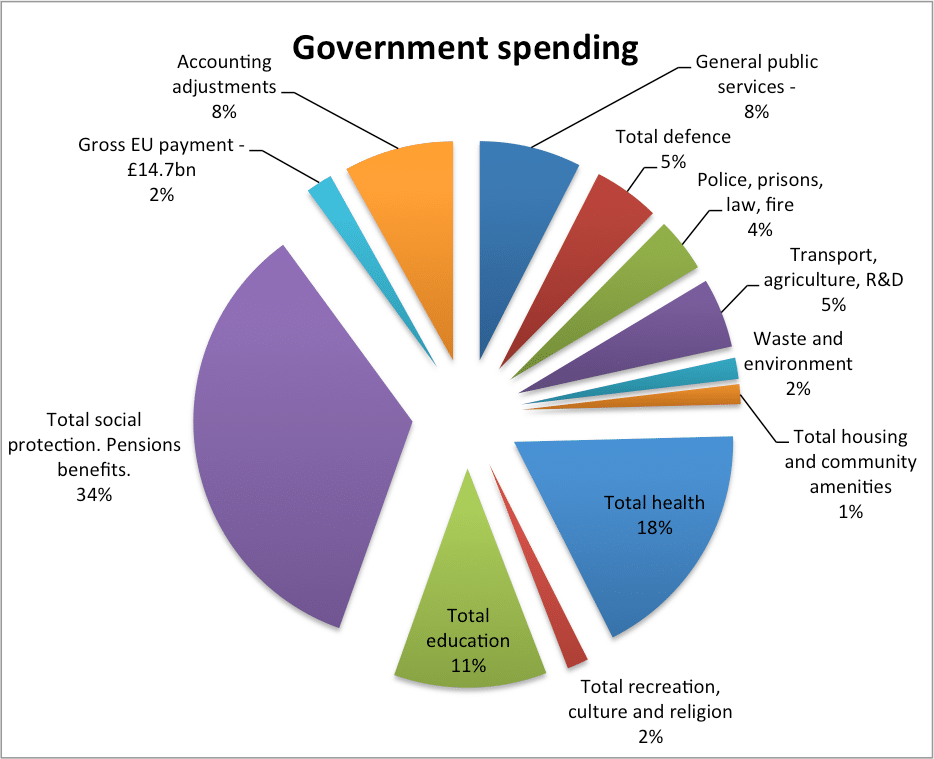
By far the largest area of government spending is social protection. £222bn (2015) 34% of government spending. However, this budget can be split up into different compartments. The biggest single item of government spending is public pensions, with NHS spending in 2nd place.
What percentage of UK spending is on the EU?
If you take gross payments (ignoring EU payments to the UK), in 2014 – £14.7 billion was transferred from the UK to the EU in official payments. This is 2% of government spending.
If you take the £7.1bn net contribution, it works out at 0.9% of public sector spending or £110 per person per year. It is 0.4% of GDP.
Total Government Spending
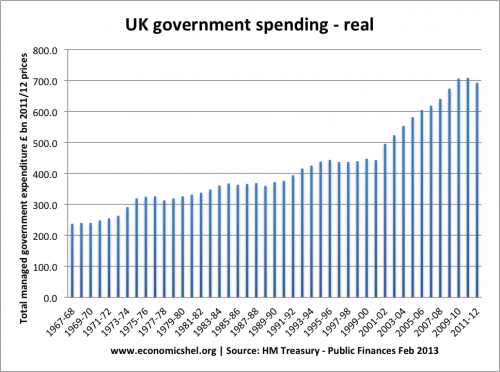
Government Spending as % of GDP
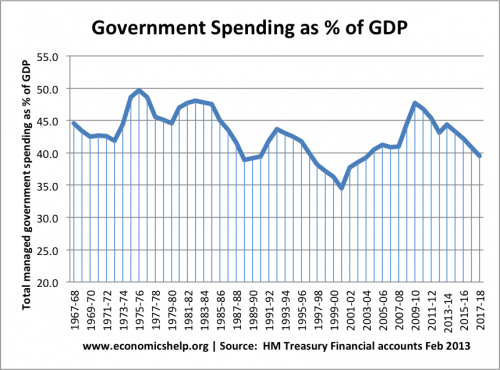
In 2010, the government embarked on tough spending cuts to try and reduce the budget deficit. However, spending on debt interest payments rose to £48bn. Also, spending on welfare benefits rose because of the increase in unemployment. Overall the government plan to keep spending static in real terms (adjusted for inflation)
See also: Total UK government spending
Changes in UK government spending
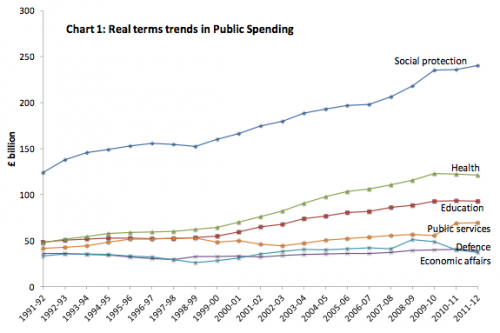
source: HM Treasury
In the past 20 years, in real terms, the biggest increase in government spending has been in the area of health care.
Welfare Payments
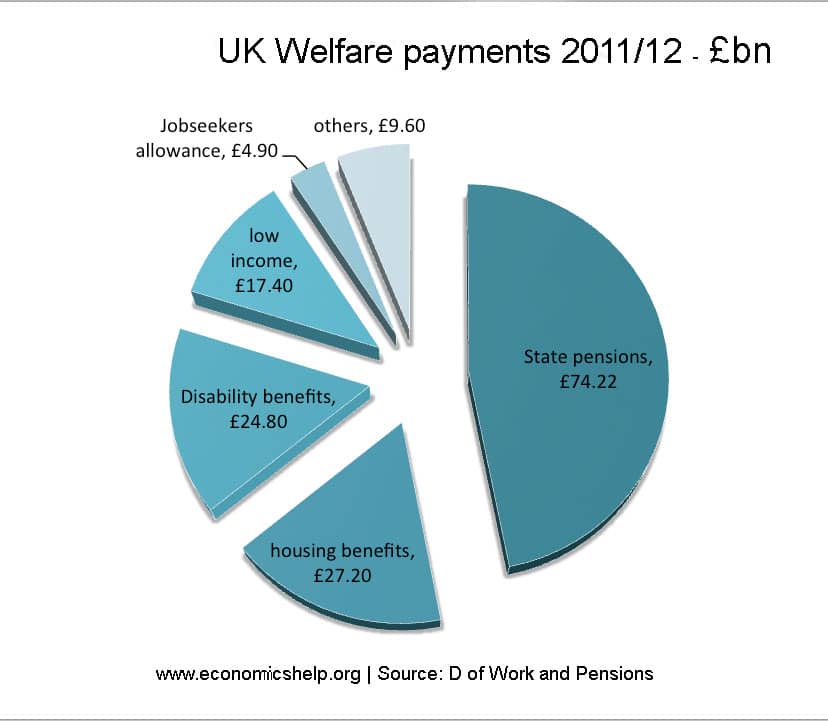
Welfare benefits (billion, bn)
- Housing benefit £16.94 bn
- Disability allowance £12.57 bn
- pensions credit +MIG £8.11 bn
- Income support £6.92 bn
- Rent rebates £5.45 bn
- Attendance allowance £5.30bn
- Incapacity £5.30 bn
- Jobseekers allowance £4.90 bn(0.7% of total spending)
- Council tax benefit £4.80 bn
- employment + Support £3.58bn
- Sick + maternity pay £2.55 bn
- Social fund £2.37 bn
- carers allowance £1.73 bn
- financial assistance £1.24 bn
- See more on UK social security payments
The welfare budget includes spending on unemployment, income support (universal credit), housing benefit and disability allowances. It increased to £105bn in 2011-12
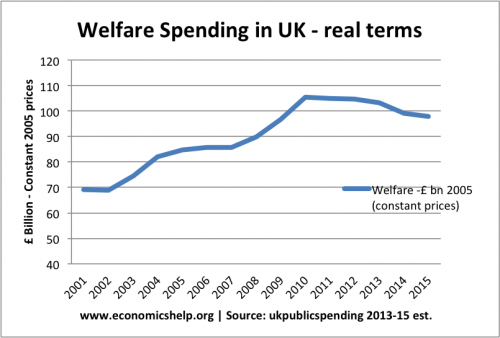
As a percentage of GDP, welfare spending is just over 7% of GDP.
Total Benefit Spending
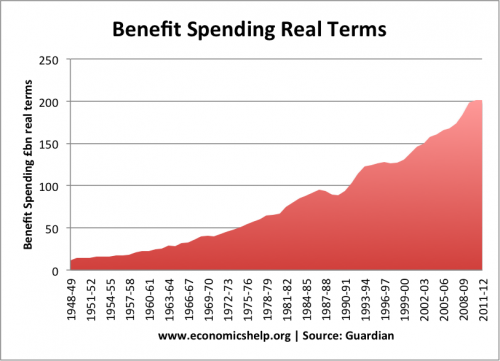
Total benefit spending includes the welfare budget, plus also the total spending on pensions. The total benefits bill for the UK was £200bn in 2012. See growing size of welfare state
Also Fire, Policing and Waste services are funded through Council tax revenue are they not. Why do they appear here then.
How much tax revenue is received annually by the Government?
If our economy is doing as well as we are told or at least better than other member states then should we not be saving money instead of spending it, or am I being to simplistic. Running through contries finance should not be so difficult and what the government spends my hard earned tax dollars on shouldn’t be so gray but much more transparent and clear. The bottom line for me is I don’t want some Germany or in the future some Turkish polotitian design on what my money, my money is spent on.
fact check at “Other notes”
What is social protection which usue up £222 billion as defense and police are already funded
What it shows is that pensions can’t be funded. I am 50 and my grandparents had a poor retirement. This generation of pensioners have seen a massive improvement. But at 50 years old I realise it’s a blip. It can not be funded. In seventeen years time there will be no money for my retirement. One generation will have spent it. That includes all the teachers, doctors, police etc who have had an early retirement. All generally funded by the state. If you live as long not working, as you did working then who is putting 50 percent of your income away to cover it. The National debit has funded a generation. Paying it off will take the next two generations.
Please note: the elderly don’t live forever, therefore public and state pensions costs aren’t fixed. As us ‘baby boomers’ die off over the next several years costs will come down.
As I have posted separately, Tax evasion looses billions every year, pensions and benefits payments are expressed in millions per year.
The wealth is being generated capable of paying for the masses of pensioners and unfortunates, but the lack of social concern and and opportunistic exploitation of tax system by some is winning at the moment.
I feel I have to apologise, having rechecked my facts I do now see that the pension figures are in billions, but the figures for Tax evasion would still resolve the deficits.
The tax gap is estimated at £36bn, which is a little bit less than the deficit. Of that total, it is estimated that £5.2bn is lost to evasion, which is less than the £6.2bn lost due to taxpayers not taking sufficient care filling in their tax returns. https://www.gov.uk/government/uploads/system/uploads/attachment_data/file/561312/HMRC-measuring-tax-gaps-2016.pdf
It makes for interesting reading
From what I could find out about benefit fraud an tax evasion on this web site, tax evasion is by far the biggest issue. Government spend on pensions and benefits is expressed in millions, Tax evasion in billions, I’ll let you do the maths.
There is a glaring error in the heading!! The Govt has no money of its own. It only has the money it takes from us – Joe Public. So the heading should read:
What does the Government spend YOUR money on.
this website is a very good website for kids like me
old people dont deserve benefits but kids like you do
Might be a daft question, but…..
If spending is 40 ish % of GDP, what happens to the other 60%?
Where does the government get it’s income to pay all this from, ???
At the lowest marginal rate £1 above the free pay limit of £11,500-per annum the government gets 45.8p (20p tax 12p EE NI & 13.8p ER NI). Other taxes local authority, VAT, petrol, insurance, Air passenger duty, stamp duty, excise & import duties etc. & someone on a modest salary is at 65%-70% in taxes. A lot of the taxes are with borrowed money eg. Car loan, mortgage (stamp duty in loan) so people don’t fully see the impact of taxes. I the early 1970’s the government take was less than half of this, no VAT, flat rate NI stamp, deductions for mortgage interest, deduction for retirement annuity premiums etc. Whilst taxes have more than doubled pensions are lowest in OECD countries, health service is on a perpetual resuscitator, there is shortage of teachers etc. This is the direct result of a decades long government policy of EXPERIMENT & DESTROY.