Readers Question: Why is debt related to GDP?
Debt to GDP shows how significant the debt is relative to the size of the economy. This is important because it affects
The size of debt compared to tax revenues.
For example in 2018, the gross level of US public debt was $21 trillion. But, with a large economy, this only accounts for 77% of US debt.
At current interest rates, the cost of servicing debt is manageable for the US government.
For example, if total government debt stayed exactly the same, but GDP fell. It would make it more difficult to finance the debt payments. If GDP fell, tax revenues would fall. Therefore, the government may have to increase tax rates to finance the debt interest payments – even though the total level of debt is the same.
On the other hand, if the economy was growing, it would be easier to pay the debt interest payments. For simplicity assume the total debt stays the same, but real GDP increases significantly. With rising GDP, the government would automatically get more income tax, VAT and corporation tax. Therefore, it would be easier to meet the debt interest payments. With higher GDP, the government can devote a small share of tax revenues to debt interest payments.
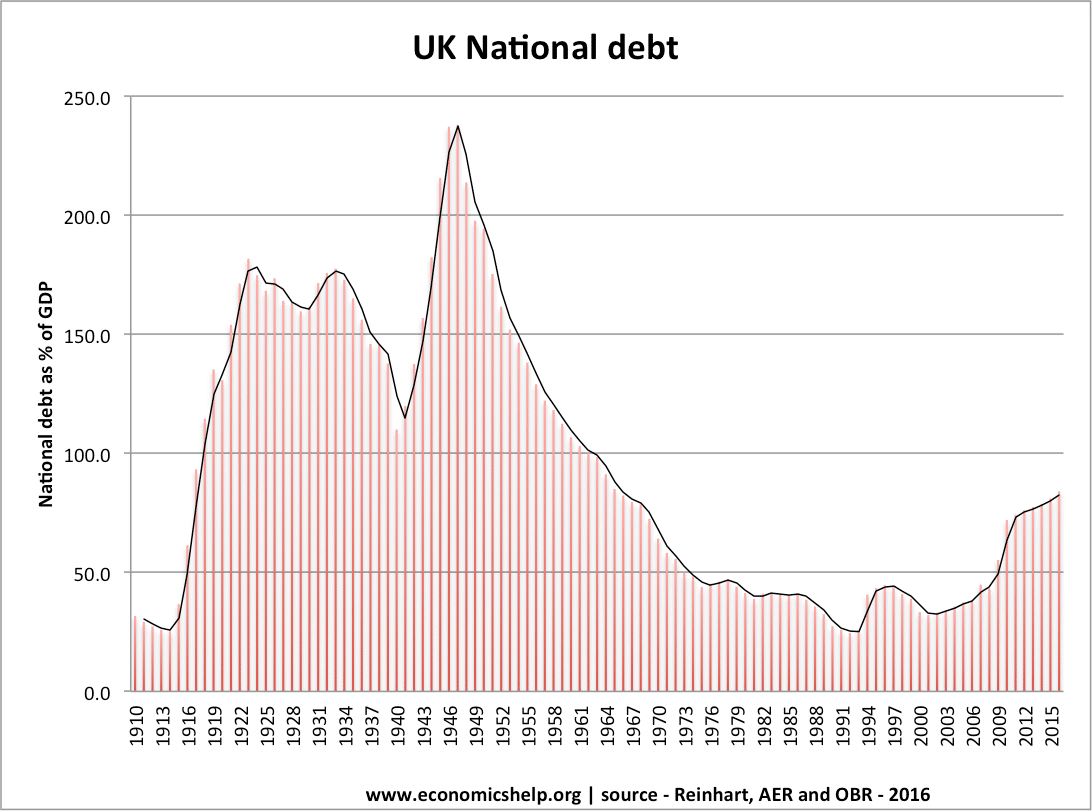
UK debt as a % of GDP

In 1950, UK total debt was £640bn (at 2005 prices). But this was 250% of GDP. In 2009, UK government debt was approx £558bn at 2005 prices – but just 44% of GDP (2009) ( – a much smaller % of GDP). (In 2011 it was 58% of GDP)
A big problem facing countries like Greece, Ireland and Spain is high borrowing combined with falling GDP. This creates a rapidly rising debt to GDP ratio and therefore markets fear the governments are quickly losing the ability to keep on top of debt interest payments.
Readers question – how can debt rise, but debt to GDP fall – an example showing the importance of debt to GDP ratios.
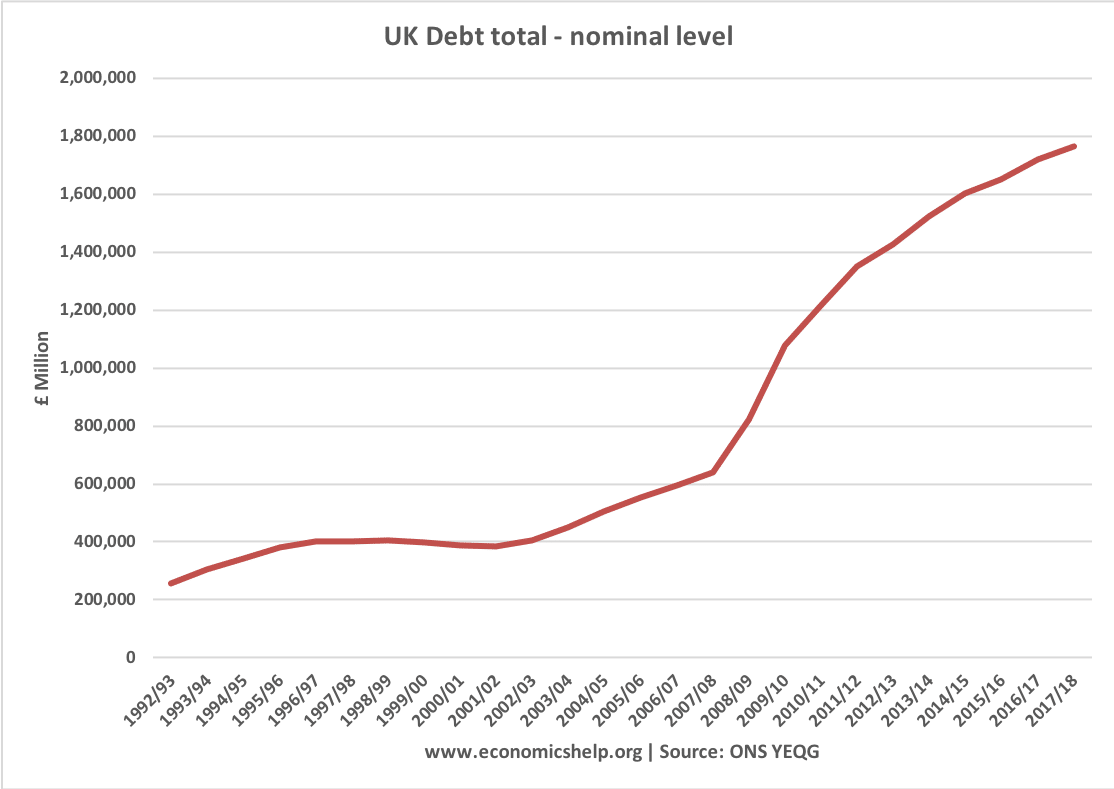
Rising debt but falling debt to GDP Ratio

This is UK total debt. Between 2001 and 2017/18, we see a sharp rise in total debt from £400bn to £178bn.
However, this absolute level of debt is a misleading impression of the relative size of the debt.

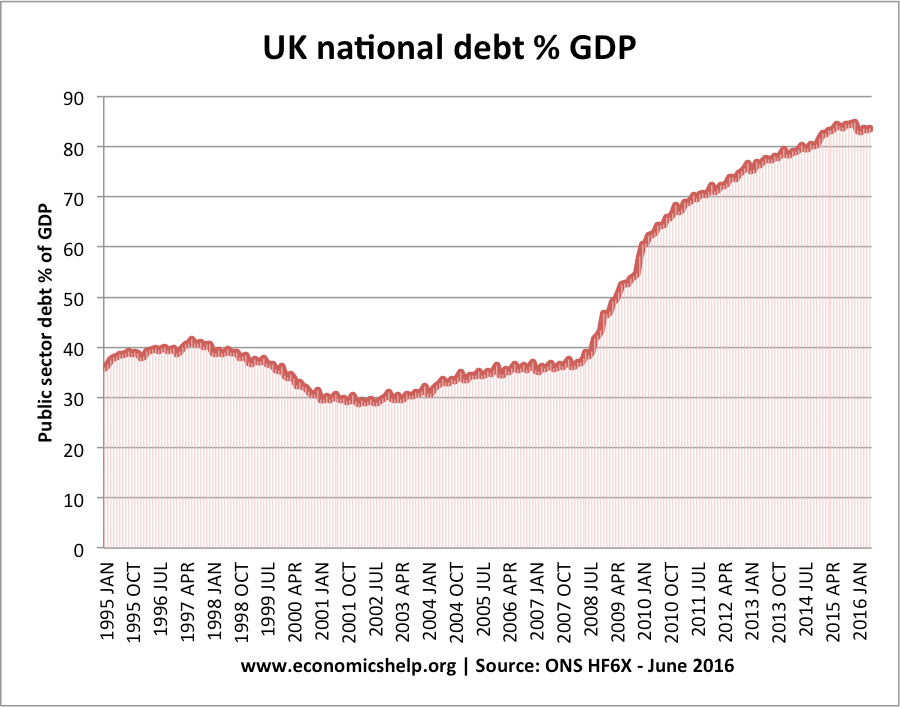
This shows that debt to GDP ratio can fall – even when total debt rises.
Between 2008-09, there was a recession and fall in GDP. Therefore, we had the worst of both worlds – falling GDP and rising debt. So we see a rapid increase in the level of debt to GDP ratio.
Other factors that are important to debt
Debt to GDP is not the only metric. It is also important to consider
- Investors confidence in governments solvency. A government like UK and US has no track record of default. But, for countries like Argentina who have defaulted, investors may require higher interest rates.
- Interest rates – bond yields on debt. During 2008-17 bond yields were at low levels, e.g. 2%. Therefore the cost of borrowing was very low. Debt interest payments as a percentage of GDP were low. However, if interest rates rise, the cost of interest payments will rise – no matter what happens to debt levels.
- State of the economy. In a recession, we expect debt to GDP ratios to rise.
Related

Where does the figure of debt being 44% of GDP come from? I find this year’s Budget reports the 2009-10 debt as being about 55%, and 2010-11 as just over 60% of GDP. The UK Public Spending website has the same or similar statistics.
44% of GDP was from 2009 statistics. 2011 is 58% of GDP