Phillips Curve Explained

phillips-curve2

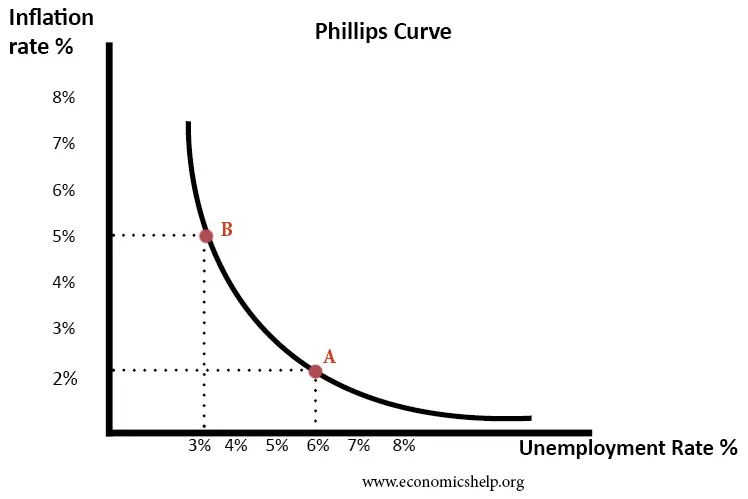
Summary of Phillips Curve The Phillips curve suggests there is an inverse relationship between inflation and unemployment. This suggests policymakers have a choice between prioritising inflation or unemployment. During the 1950s and 1960s, Phillips curve analysis suggested there was a trade-off, and policymakers could use demand management (fiscal and monetary policy) to try and influence …

Read more

Bond Yield Curves

Recently I wrote about impact of rising bond yields on long term bonds. There is uncertainty whether the rise in bond yields reflects economic growth or worries over government debt. This post explains the inverse relationship between bond yields and bond prices Bond Yield Curve Definition: The bond yield curve reflects the yield on government …

Read more

Backward Bending Supply Curve

backward-bending-supply-curve

A typical supply curve shows an increase in supply as wages rise. It slopes from left to right. However, in labour markets, we can often witness a backward bending supply curve. This means after a certain point, higher wages can lead to a decline in labour supply. This occurs when higher wages encourage workers to …

Read more

Environmental Kuznets curve

kuznets-environment

Definition: The environmental Kuznets curve suggests that economic development initially leads to a deterioration in the environment, but after a certain level of economic growth, a society begins to improve its relationship with the environment and levels of environmental degradation reduces. From a very simplistic viewpoint, it can suggest that economic growth is good for …

Read more

Lorenz Curve

lorenz-curve-a-b

Definition: The Lorenz curve is a way of showing the distribution of income (or wealth) within an economy. It was developed by Max O. Lorenz in 1905 for representing wealth distribution. The Lorenz curve shows the cumulative share of income from different sections of the population. If there was perfect equality – if everyone had …

Read more

Shift in Demand and Movement along Demand Curve

shift-in-demand

A shift in demand means at the same price, consumers wish to buy more. A movement along the demand curve occurs following a change in price. Movement along the demand curve A change in price causes a movement along the demand curve. It can either be contraction (less demand) or expansion/extension. (more demand) Contraction in …

Read more

Shape of aggregate supply curves (AS)

monetarist-inflation-LRAS

The aggregate supply curve shows the total supply in an economy at different price levels. Generally, the aggregate supply curve slopes upwards – a higher price level encourages firms to supply more. However, there are different possible slopes for the aggregate supply curve. It could be highly inelastic (vertical) to very elastic. It is important …

Read more

Kinked demand curve

kinked-demand-curve

A kinked demand curve occurs when the demand curve is not a straight line but has a different elasticity for higher and lower prices. One example of a kinked demand curve is the model for an oligopoly. This model of oligopoly suggests that prices are rigid and that firms will face different effects for both …

Read more

Item added to cart.
0 items - £0.00