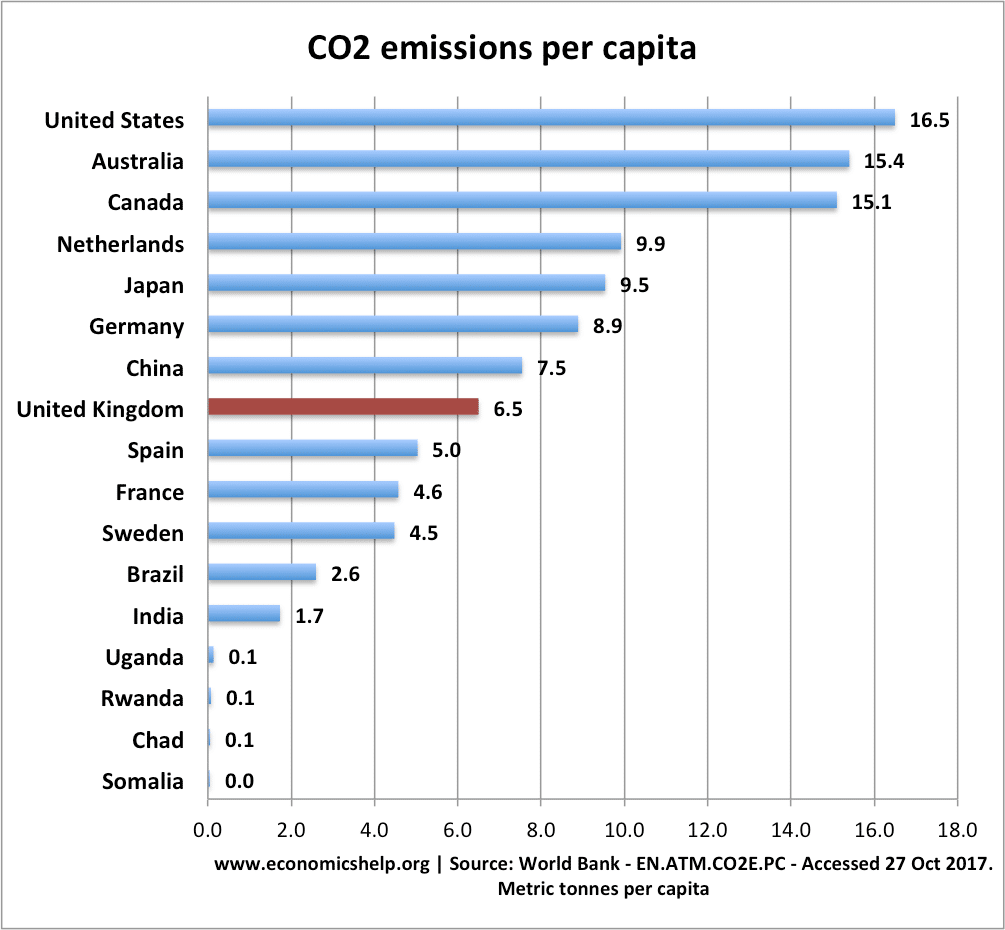
The biggest absolute emissions of CO2 come from China and the United States.

Source: World in Data

In recent years, China has accelerated past the United States and is the biggest polluter in absolute terms, (which is unsurprising given China’s population and fast economic growth. India is also catching up.)
Biggest CO2 Polluters per capita (2024)
| 1 | Qatar | 48.2 |
| 2 | Bahrain | 23.7 |
| 3 | Kuwait | 23.0 |
| 4 | Brunei | 21.2 |
| 5 | Trinidad and Tobago | 19.9 |
| 6 | UAE | 19.6 |
| 7 | Saudi Arabia | 18.5 |
| 8 | Oman | 18.4 |
| 9 | Russian Fed | 14.4 |
| 10 | Canada | 14.3 |
| 11 | Australia | 14.0 |
| 12 | USA | 13.9 |
| 13 | Kazakhstan | 11.8 |
| 14 | Korea, Rep. | 11.1 |
| 15 | Luxembourg | 10.5 |
| 16 | Singapore | 9.6 |
| 17 | China | 9.4 |
| 18 | Turkmenistan | 9.0 |
| 19 | Iran, Islamic Rep. | 8.6 |
| 20 | Libya | 8.4 |
| 21 | Estonia | 8.3 |
| 22 | Czechia | 8.3 |
| 23 | Mongolia | 8.1 |
| 24 | Malaysia | 8.1 |
| 25 | Norway | 8.0 |
| 26 | Iceland | 7.8 |
| 27 | Poland | 7.8 |
| 28 | Japan | 7.6 |
| 29 | Belgium | 7.2 |
| 30 | Germany | 6.9 |
| 31 | Bosnia and Herzegovina | 6.9 |
| 32 | Netherlands | 6.9 |
| 33 | New Zealand | 6.8 |
| 34 | Austria | 6.4 |
| 35 | Slovak Republic | 6.4 |
| 36 | South Africa | 6.3 |
| 37 | Central Europe and the Baltics | 6.3 |
| 38 | Israel | 6.2 |
| 39 | Bulgaria | 6.2 |
| 40 | Ireland | 6.1 |
| 41 | Belarus | 5.9 |
| 42 | Finland | 5.8 |
| 43 | Slovenia | 5.7 |
| 44 | European Union | 5.6 |
| 45 | Maldives | 5.5 |
| 46 | Bermuda | 5.4 |
| 47 | Cyprus | 5.3 |
| 48 | Italy | 5.2 |
| 49 | Turkiye | 5.1 |
| 50 | Greece | 5.0 |
| 51 | Cayman Islands | 4.9 |
| 52 | North Macedonia | 4.8 |
| 53 | Hong Kong SAR, China | 4.6 |
| 54 | Hungary | 4.6 |
| 55 | Lithuania | 4.6 |
| 56 | Croatia | 4.5 |
| 57 | Denmark | 4.5 |
| 58 | Spain | 4.5 |
| 59 | United Kingdom | 4.4 |
| 60 | Puerto Rico (US) | 4.3 |
| 61 | Iraq | 4.3 |
| 62 | Chile | 4.3 |
| 63 | Bahamas, The | 4.2 |
| 64 | Azerbaijan | 4.2 |
| 65 | Suriname | 4.2 |
| 66 | France | 4.1 |
| 67 | Moldova | 4.0 |
| 68 | Argentina | 4.0 |
| 69 | Guyana | 4.0 |
| 70 | Algeria | 3.9 |
| 71 | Uzbekistan | 3.9 |
| 72 | IDA & IBRD total | 3.9 |
| 73 | Switzerland | 3.9 |
| 74 | Thailand | 3.8 |
| 75 | Mexico | 3.8 |
| 76 | Viet Nam | 3.7 |
| 77 | Romania | 3.7 |
| 78 | Ukraine | 3.6 |
| 79 | Latvia | 3.5 |
| 80 | Antigua and Barbuda | 3.5 |
| 81 | Georgia | 3.5 |
| 82 | Portugal | 3.4 |
| 83 | Lao PDR | 3.4 |
| 84 | Sweden | 3.4 |
| 85 | Mauritius | 3.3 |
| 86 | Panama | 3.3 |
| 87 | Malta | 3.0 |
| 88 | Lebanon | 3.0 |
| 89 | Botswana | 3.0 |
| 90 | Venezuela, RB | 3.0 |
| 91 | Barbados | 2.8 |
| 92 | Dominican Republic | 2.8 |
| 93 | Armenia | 2.6 |
| 94 | Uruguay | 2.6 |
| 95 | Tunisia | 2.6 |
| 96 | Middle East, North Africa, Afghanistan & Pakistan (IDA & IBRD) | 2.6 |
| 97 | Bhutan | 2.5 |
| 98 | Ecuador | 2.5 |
| 99 | Korea, Dem. People’s Rep. | 2.4 |
| 100 | Jamaica | 2.4 |
| 101 | Indonesia | 2.4 |
| 102 | Fiji | 2.4 |
| 103 | Brazil | 2.3 |
| 104 | Turks and Caicos Islands | 2.2 |
| 105 | Egypt, Arab Rep. | 2.2 |
| 106 | Samoa | 2.2 |
| 107 | Tonga | 2.1 |
| 108 | Jordan | 2.1 |
| 109 | India | 2.1 |
| 110 | Equatorial Guinea | 2.0 |
| 111 | Cuba | 2.0 |
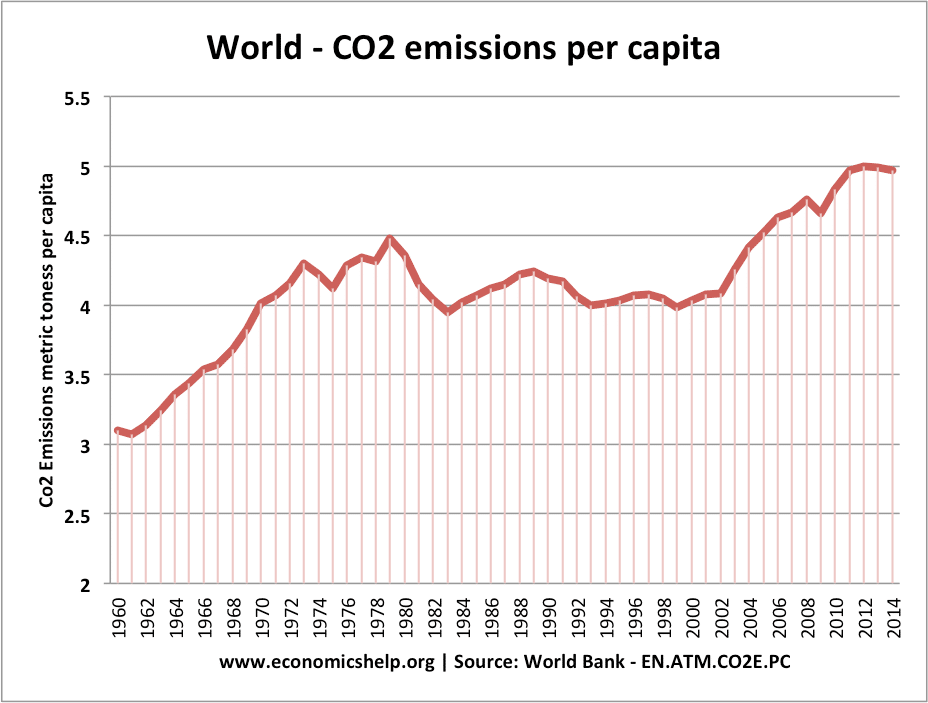
This measures the level of CO2 per person. Thus China with the highest CO2 in absolute terms is ranked considerably lower down.
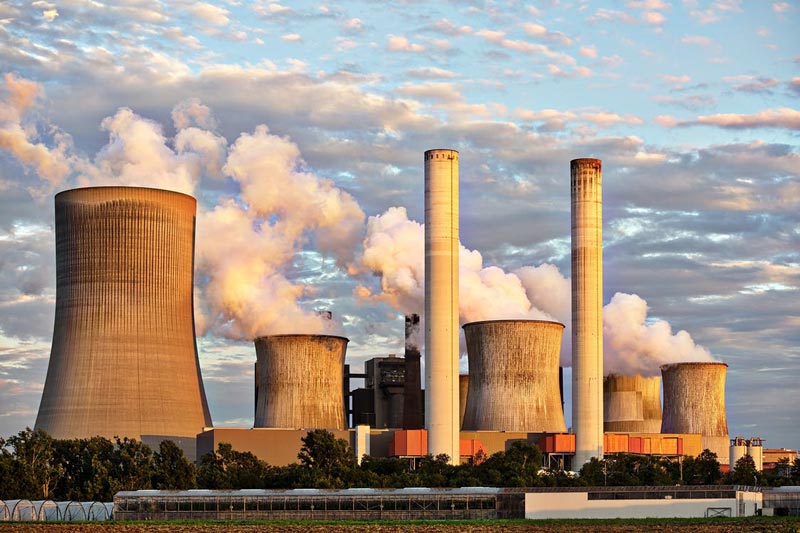
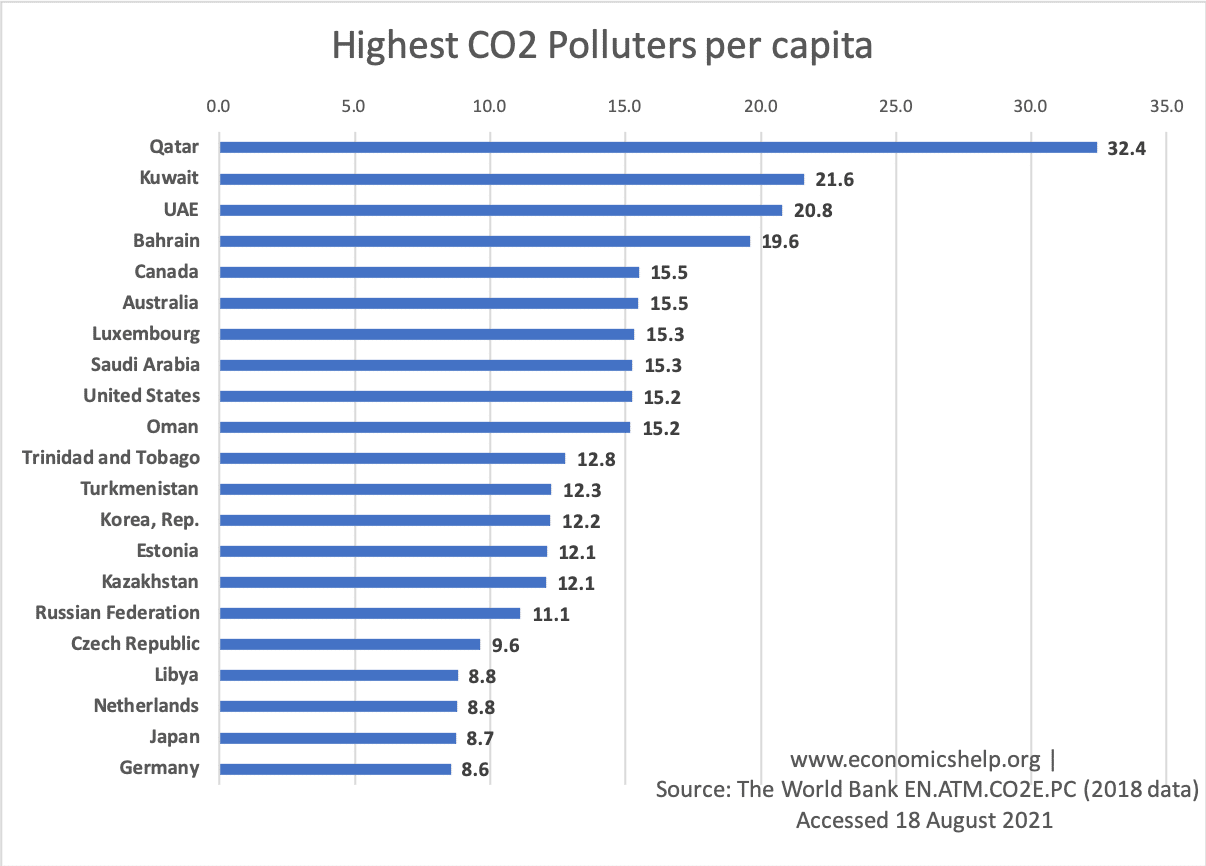 The highest CO2 Polluters per capita are dominated by oil producing countries who refine oil and emit CO2 in the oil extraction and refining process.
Consumption-based emissions (trade adjusted)
It is worth bearing in mind that this data shows CO2 production in a country. CO2 by consumption would look different. For example, the UK is a net importer of CO2. In recent decades, the UK has reduced CO2 emissions per capita because manufacturing has declined and we import goods from other countries. In other words, CO2 emissions are produced elsewhere but the UK enjoy the goods.