It’s been a good few decades for the top 1%, with big rises in income and wealth.
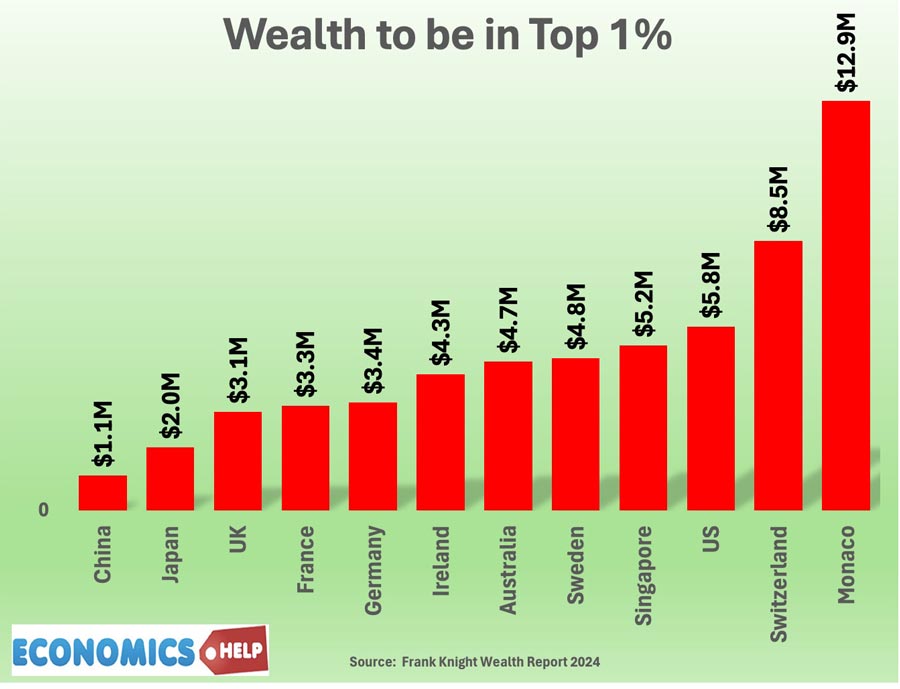
But, what does it take to be in the top 1% by income, wealth, land-ownership and house values? If we look at the metric of wealth, a Swiss would need $8.5m, an American would need $5.8 million and a British citizen a paltry $3.1 million to be in the top 1%.
Top 1% by Income is different. In the UK from 1900 to 1980, the top 1% saw a decline in relative income share. It was an era of rising equality. But, in the past 30 years, this has gone into reverse, some say a new gilded age for the rich. But, what kind of income levels would mean you would count as a top 1% earner?
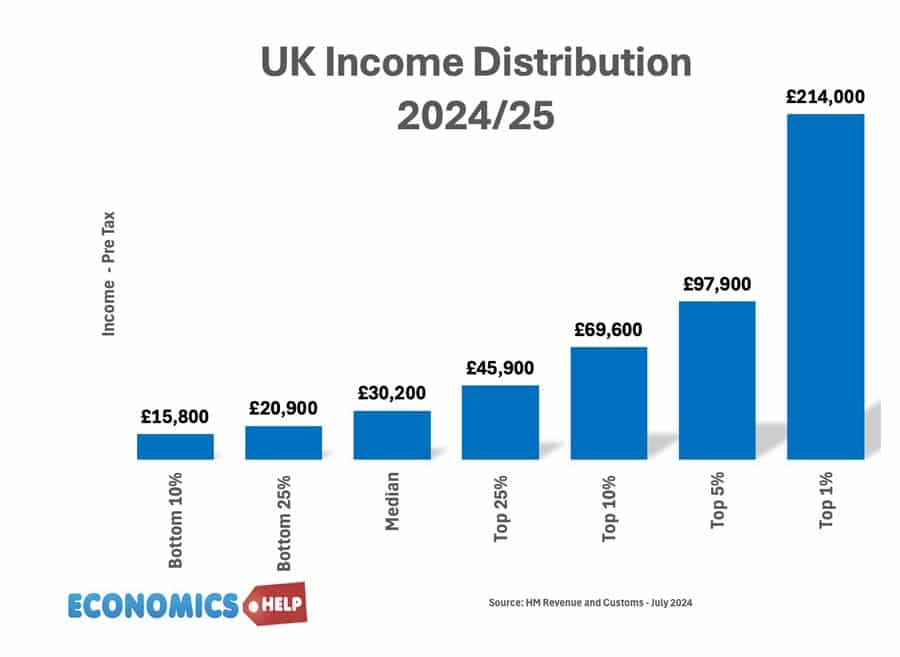
Using self-assessment income tax data from HM Revenue and Customs, we can see that the median pre-tax income in the UK is £30,200. On this salary, tax would be £5,300 leaving the median worker a post-tax income of £24,911 or £2,000 a month To get into the top 1% of income earners at the turn of the millenium would require a pre-tax salary of £96,000. This tax year, the income level necessary to make the top 1% would be £216,000. Though it is worth emphasising that is the lower limit to be in the top 1%. The top 0.1% of income earners had an income of over £650,000. The distribution of income is like a bell curve with increasing inequality the more you earn.
Tax
On a salary of £216,000, a top 1% earner will pay nearly £91,000 in tax – which means the take-home pay of a worker on this salary will be £125,000 or £10,000 a month. If you were in top 0.1%, you would pay £294,468 an effective tax rate of 45%, leaving you with £355,532 in post-tax income. However, there is an important caveat, the amount of tax the top1% pay can vary. Because income from capital gains and investment income are taxed at lower rates than income from work. A study by the LSE suggested that the average tax rate paid by a person receiving a million pounds was 35%. One in four paid 45%. One quarter paid 30% and one in ten paid just 11%. The rich are not all in it together. It is also worth mentioning this income doesn’t include income which is not declared or capital gains.
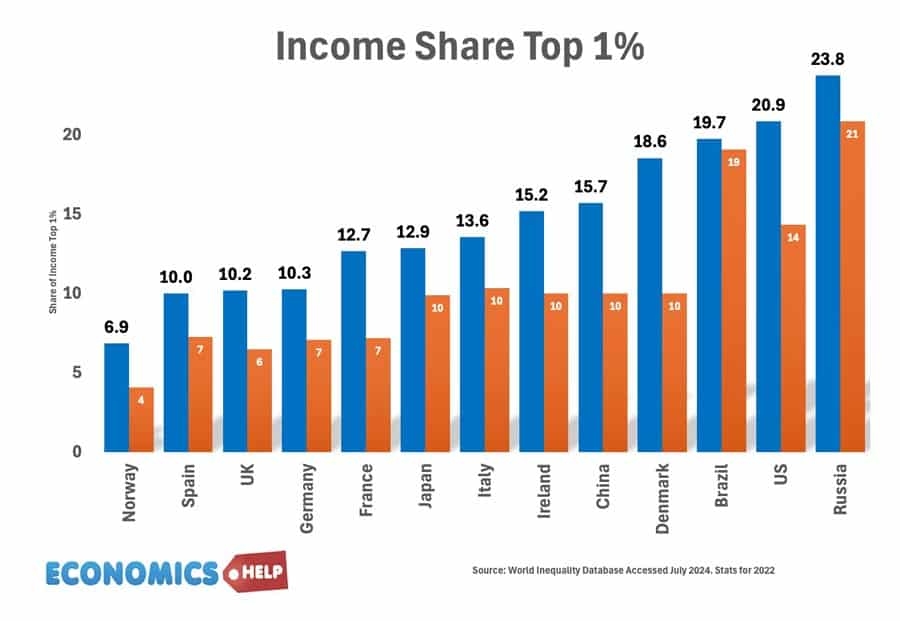
This shows that tax rates are important for determining the final income share.
Are you rich or average?
Interestingly a polling firm Redfield & Wilton reported that 60% of those on salaries of £80,000-£100,000 believe they are “about average” on the income scale. In fact a salary of £98,000 would be sufficient to be in the top 5% of income earners. An annual income of over £46,000 would put you in the top 25%
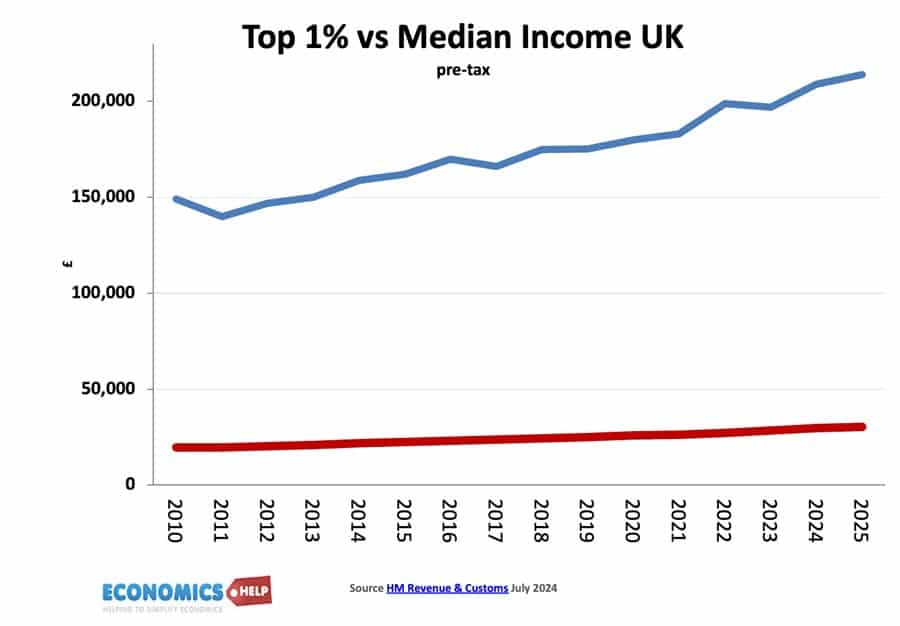
The gap between the median worker and top 1% worker has grown in the past 20 years, which is reflected in the higher income share of the top 1%.
This rise in incomes for high earners means that the top 1% of eaners now pay 29% of all income tax. This used to be 21% in 2000. Between 1979 and 2008 the tax take from top 1% rose because the rich got significantly more rich. In recent years, some policy changes have seen higher rates of tax on the top 1%. The top 10% of earners pay over 60% of income tax revenue. Though don’t forget many other taxes like VAT and excise duties.
Typical 1%
What is the typical person who will be in the top 1% by income in the UK? He is likely to be a man, living in London, middle aged, and probably working in finance, law, or accountancy. There must be a fair few professional footballers. Forget the Premier league, the average championship player is on a salary fo £10,000 a week, or £520,000 a year. Comfortably enough to be in the top 1% of income eaners.
There is a large income difference by region. For example, in 2016, in Wales an income of £100,000 would put you in top 1% within Wales. But, in London, it would be £300,000. There is a significant gender gap with men more likely to have higher incomes. Another interesting point is that being in the top 1% by income is relatively unstable. On average after five years only half of the top 1% will still be there. We shall see how wealth is much more stable, but in terms of income, there is considerable uncertainty about how long you will stay in top 1%. Also, if we focus only on income, living standards can be quite different. If you’re living in London, paying market rent, sending your kids to private school, suddenly a post-tax salary of £125,000 can go quickly. This is why you can get hard luck stories from even the top 1% of income earners. People do tend to underestimate how high their salary is compared to the national average. It is why it is important to look beyond income to wealth. If you fully own a property in London without a mortgage, you can be better off than someone on double your salary.
Wealth
For real membership in the 1% club, we need to take this wealth into account. And when it comes to wealth, the top 1% take a much bigger share. Like income after the war, wealth inequality declined as many old estates were sold off, and homeownership increased. But, in recent years, the trend has been reversed.
According to the ONS, median household wealth in Great Britain was £302,500. The wealth of the richest 1% of the househoolds was £3.6 million. Despite being the latest data it refers to 2020, so will have increased since then.
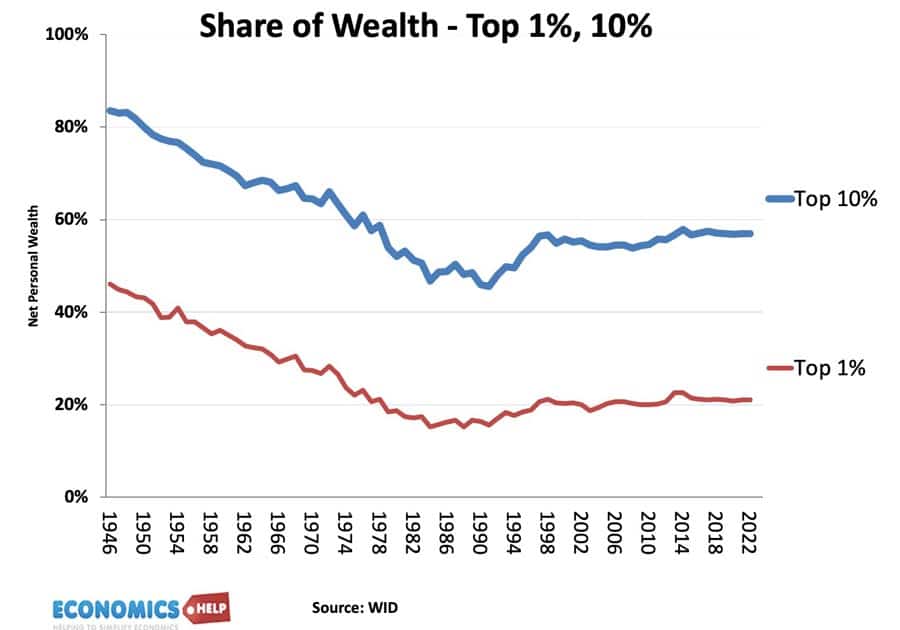
In fact the big story of the past 14 years has been rising wealth inequality. Between 2010 and 2021, the wealth of the richest 1% increased 31 times more than the bottom 99%. Of the £4tn increase in wealth in this period, nearly a quarter went to the top 1%. It is was a period of rising asset prices, and as wealth increases so does dividends, rent and income which can be reinvested in more wealth. Many struggling to get buy have no luxury of increasing wealth. The era of ultra-low interest rates and quantitative easing was more suited to growing wealth than income. The UK share of wealth to income grew in this period.
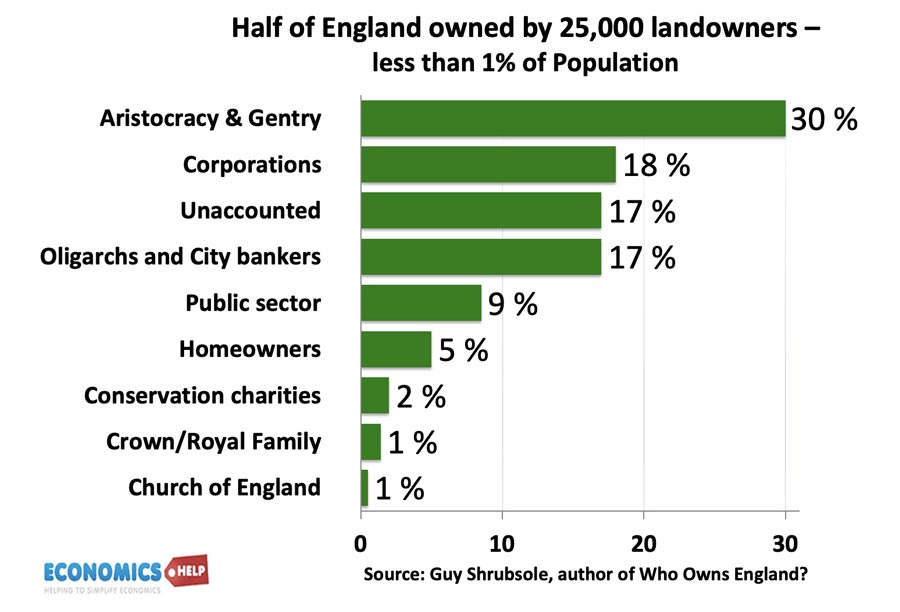
One of the greatest areas of inequality is in landownership. It is more difficult to find statistics on landownership because they are hard to get. Guy Shrubsole who wrote a book “Who Owns England” which went to great lengths to work out who owns land. Even then 17% of land is unaccounted for. But, the book suggests that the top 1% of landowners own half the land in England. The biggest group is the aristocracy and gentry with 30% of land, followed by corporations at 18%. Whilst the top 1% by income can vary from year to year. Wealth and land are much more stable, with much of England remaining in the same families for years, if not centuries. With changes to inheritance tax, this is quite topical. In the past 23 years, the value of farmland has risen by 351% making it one of the best-performing assets in this period. The reason is that buying farmland was an excellent way for millionaires to avoid inheritance tax.
1% House Prices
In the UK the latest land registry data suggest the average house price is £292,000. But, what kind of house price would put the house into top 1% of home values? In London, average selling prices are £525,000. The top one per cent of the market comes in at £4.75m. The average price of a property in the top 1% in the North East is £533,000. The average price of a property in the top 1% in the South East is £1.35 million.
So the top 1% have done better in recent years, but not so much the average worker. Does this mean things were better in the past. This video looks at all the pros and cons of so called progress.
https://ifs.org.uk/articles/how-tax-burden-high-when-most-us-are-taxed-so-low
https://www.lse.ac.uk/research/research-for-the-world/economics/how-much-tax-do-the-rich-really-pay
