
- When examining debt levels in the UK, there is government debt – measured by public sector borrowing (often referred to as National debt). See: UK National Debt.
- We also have private sector debt which is composed of personal loans, personal mortgages, business debts, and debts of the financial sector.
- Total Debt includes both private sector debt plus government debt.
- Private sector debt can be split up into
- Household debt – personal loans
- Non-Finance corporates – Company debts
- Financial – debts of banks and financial corporations
Total UK debt
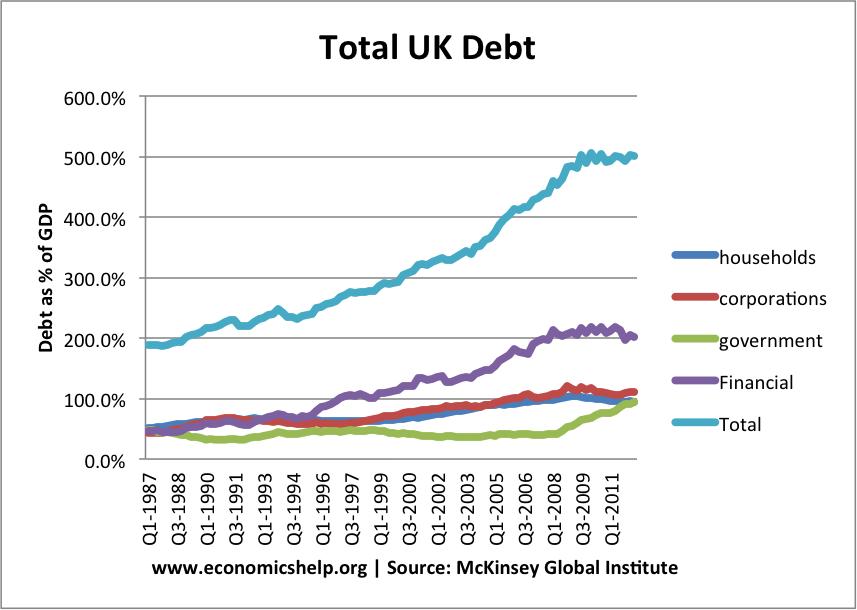
Total UK debt increased sharply in period 1994-2007.
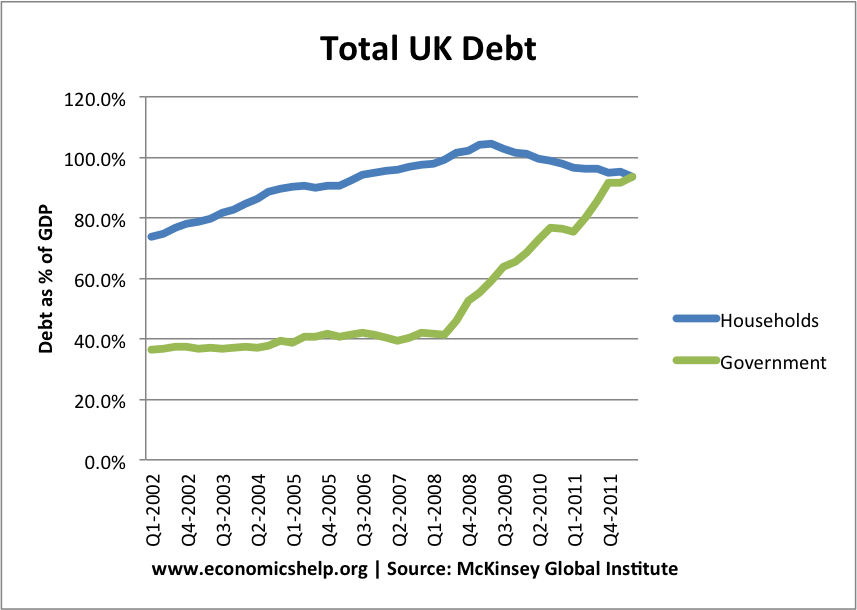
Since 2008, there has been a fall in household debt as a % of GDP – as households cut back debt levels. (note GDP also fell in this period)
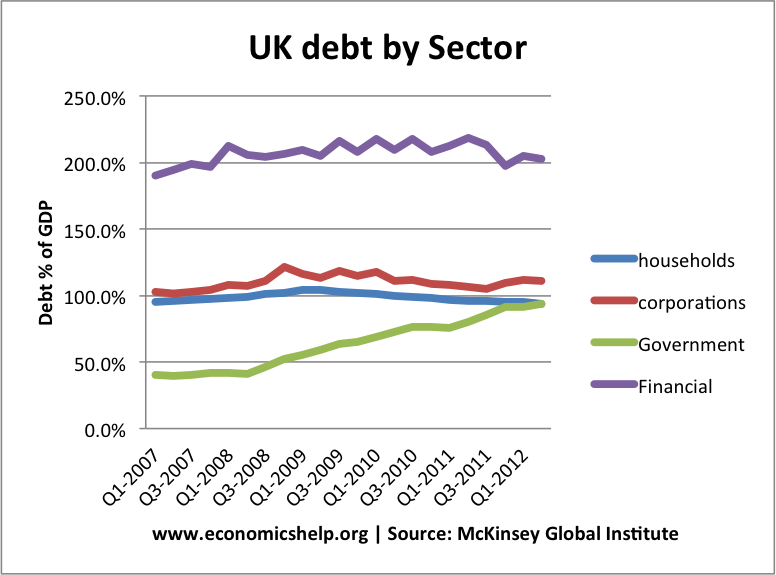
Financial sector debt has stayed constant at 200% of GDP.
Main Features
- Total UK debt is 500% of GDP in mid 2012
- The largest component of debt is from the financial sector.
- The deleveraging is greater than may appear from the statistics. Although debt levels have remained flat, this is against the backdrop of falling real incomes.
Compare experience of US – where total debt fell in period 2009-12.
Overall Indebtedness in Developed Economies
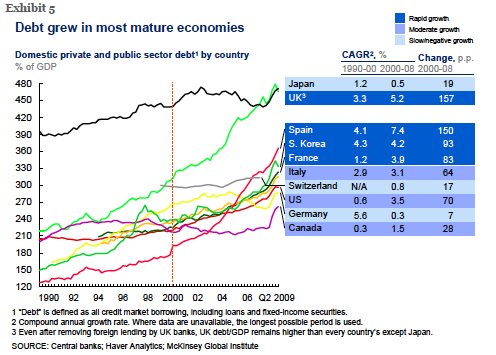
Source: Debt and Deleveraging pdf at McKinsey
The UK has seen the biggest rise in total UK debt in past 20 years. Only Japan is slightly higher.
Private Sector Debt
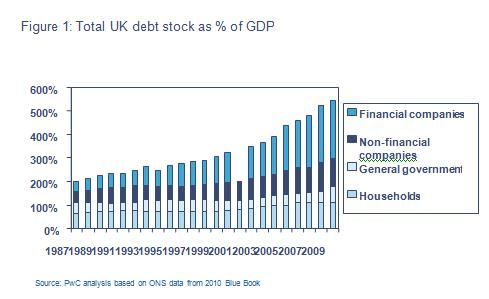 source: PWC
UK total debt is forecast to rise to £10 trillion by 2015.
Some Notes
- There are big differences between different types of debt, e.g. mortgage debt has low risk of default and is secured against value of asset. In boom years, some of banks debt was highly risky and highly leveraged with little or no security. When credit crisis came, they were short of money and couldn’t get loans bank.
- The high level of debt by UK financial institutions is also a reflection of the size of the finance sector relative to the size of the UK economy.
- Since 2008, UK consumers have reduced debt levels. However, the fall in GDP has meant the decline in debt as a % of GDP has been limited.
- Low interest rates have made debt repayments relatively manageable. But, if interest rates were to rise, it would be more serious.
- Bond yields are low on UK government debt
- The recession led to a big fall in consumer spending as banks and consumers tried to pay off debt, this decline in private sector spending caused an increase in government borrowing. This increase in government borrowing helped to prevent a bigger fall in aggregate demand and more serious recession.
Long Term Impact of High Debt Levels
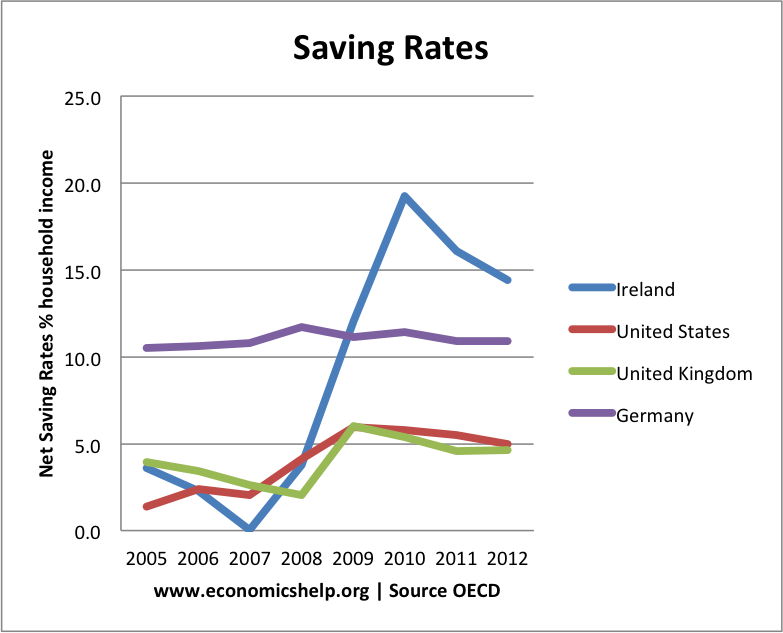
To improve debt position, consumers try to increase overall savings.
What does this debt mean?
- In the current climate, the high debt overhang, will curtail investment and spending. As firms, banks and consumers try to improve their debt position, it will lead to lower demand in the economy. This is exacerbated by government spending cuts as it tries to improve its own fiscal position.
- International comparisons are not everything. UK and Japan have the highest total debt levels, but they are not facing higher bond yields like in Italy and Spain.
- The size of the financial sector inflates the UK total debt, and it should be remembered it is important to compare to assets. But, high debt levels are significant.
- The high level of debt is one reason why it has been so difficult to get out of recession. It bears all the hallmarks of a balance sheet recession.
- The policy of quantitative easing has helped to a limited extent offset the fall in private sector spending. However, it monetary policy has been fairly limited.
- To a small extent, Inflation in the UK has also been ‘inflating away our debts‘
Max Kieser has just told viewers of RT that UK total debt is 10 times GNP with the financial
sector 6 times GNP.If this correct,the country really is in trouble-I hear America’s troubles started with debt of 1.2 times GNP for the financial sector.
Debt is high because the UK has a large banking sector relative to the rest of the economy, but this viewpoint totally ignores the asset side of the balance sheet.
The NET liabilities are actually much lower e.g. in 2008, UK overseas liabilites were £6.7trn but UK overseas assets were £6.4trn.
Max Keiser is hired by RT to broadcast anti British propaganda on behalf of Putin.
Does that answer your query?
No, propaganda is not a satisfactory answer.
Here is a link using a graph based on Morgan Stanley Research:
http://www.zerohedge.com/news/psssst-france-here-why-you-may-want-cool-it-britain-bashing-uks-950-debt-gdp
In here, we see total UK debt is 1000% of GDP, mostly based on financials. And is way above other countries. Which, in a sense, if a double dip recession will occur, banks will have losses and the debt they issued will be in troubles.
And Robert, what kind of assets does the UK financial sector hold overseas? Like the junk subprime MBS from US? That is a smart asset to be hold in the books without marking it to market price.
Get ready for a lost decade we have a weak government with no real ideas and when the markets realise this you watch the yields on our bonds shoot up unfortunatly we are not we are not fooling any anyone
Where can I find to Total UK Assets – Is the Total UK Debt nett of assets? If so how are the values of both assets and debts assessed?
I have information suggesting Total UK Debt expressed in terms of the price of gold in 1900 is the same now as in 1850, but I cannot find figures for the assets
The ONS publish a figure for the nett worth of the UK. http://www.ons.gov.uk/ons/rel/mro/news-release/uk-worth–6-8-trillion/nbsnr0812.html
In 2011 the net worth was £6.8 trillion. If total debt is 500% of GDP that is about £7.5 trillion. In other words the UK is 110% in debt.
The Weimar government of Interwar Germany saw debt levels of 900% of GDP and look what happened to that! I can’t find any examples of high debt levels being reduced short of a financial collapse.
Yes 900% of GDP is high, but, at 70%, the UK still has someway to go to meet Weimar.
The UK reached over 200% of GDP in early 1950s, but it was reduced during the longest period of economic expansion on record.
Id like see see uk debt broken down I. Detail by each uk country. We never see any results for england .