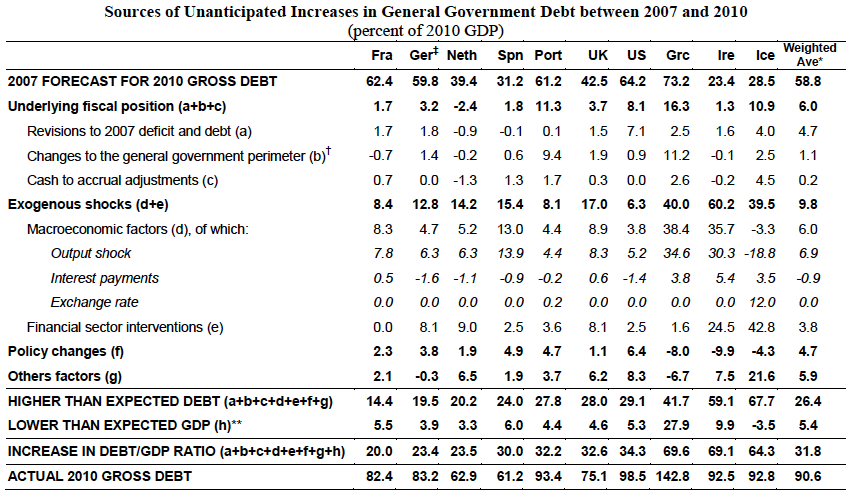
One feature of the recent crisis has been the degree to which governments underestimated the forecast rise in government borrowing. The IMF produced a report which looked at forecast debt from 2007, and what debt actually was three years later. In ten selected countries, the increase in the gross debt ratio 31.8
- 2007 forecast for debt in 2010 – 58.8% of GDP.
- Actual government debt in 2010 – 90.6% of GDP
To some extent, this reflects the wider failure to forecast the recession. As well as underestimating debt levels, governments proved widely optimistic on GDP and unemployment. However, the recession wasn’t the only reason for governments to underestimate debt levels. There were also failures to account for liabilities, such as hidden obligations to public corporations and Public private finance initiatives. This shows that many countries need to improve their fiscal transparency.
- Fiscal transparency can be defined as the clarity, reliability, frequency, timeliness, and relevance of public fiscal reporting and the openness to the public of the government’s fiscal policy-making process.
Why Forecasts were Wrong
There was quite a degree of variability in why debt forecasts were wrong. For example, in the UK there was only a minor underestimation of its fiscal position (3.7% of GDP). Most of the UK’s higher than expected debt were a consequence of the unexpected recession and financial sector intervention.
Interestingly, three countries which had the biggest underestimation of their structural fiscal position in 2007, were:
- Greece (16.7% of GDP)
- Portugal (11.3% of GDP)
- Iceland (10.9% of GDP)
These countries also experienced some of the biggest drops in investor confidence. – showing that if governments have a poor understanding of their underlying fiscal position, investors can lose confidence quicker.

Causes of Fiscal Shock
Reasons why debt proved higher than it was forecast
1. Underlying fiscal position. This includes revisions to data, but also includes hidden obligations to public corporations, PFI and other public entities. Greece and Portugal had the biggest amount of hidden debt. In Greece’s case the realisation that the government owed more than previously thought was a key factor in the rapid decline of confidence in Greek bonds (though there were many other factors too)
2. Exogenous Shocks. This is macro economic factors that caused a deterioration in the fiscal position.
- Output Shock. An output shock refers to the lower than expected growth (recession) leading to a fall in tax revenues and higher spending on benefits. For the UK, this accounted for an increase of 9% of debt / GDP levels. Note, Greece and Ireland’s output shock saw debt to GDP rise 36% points. This was double Greece’s fiscal mismanagement
- Financial sector intervention. Ireland’s bank bailout saw debt to GDP levels rise 42% of GDP.
- Interest rate changes. Some countries, like US and Germany saw lower interest payments thanks to lower bond yields. Greece and Ireland saw much higher bond yields. Post 2010, more countries like Portugal and Italy have been affected by rising bond yields.
Notes on UK
The IMF report gives UK good marks for fiscal transparency – quality of reporting. But, note the UK forecasts were let down by:
- Limited exploration of different potential macro economic scenarios
- Neglecting the implicit guarantee given to the financial sector
- Ignored growing exposure to public private partnership liabilities.
Related
- Fiscal transparency at IMF pdf
- Does government debt matter?
- Debt and Crisis at BBC – Stephanie Flanders
