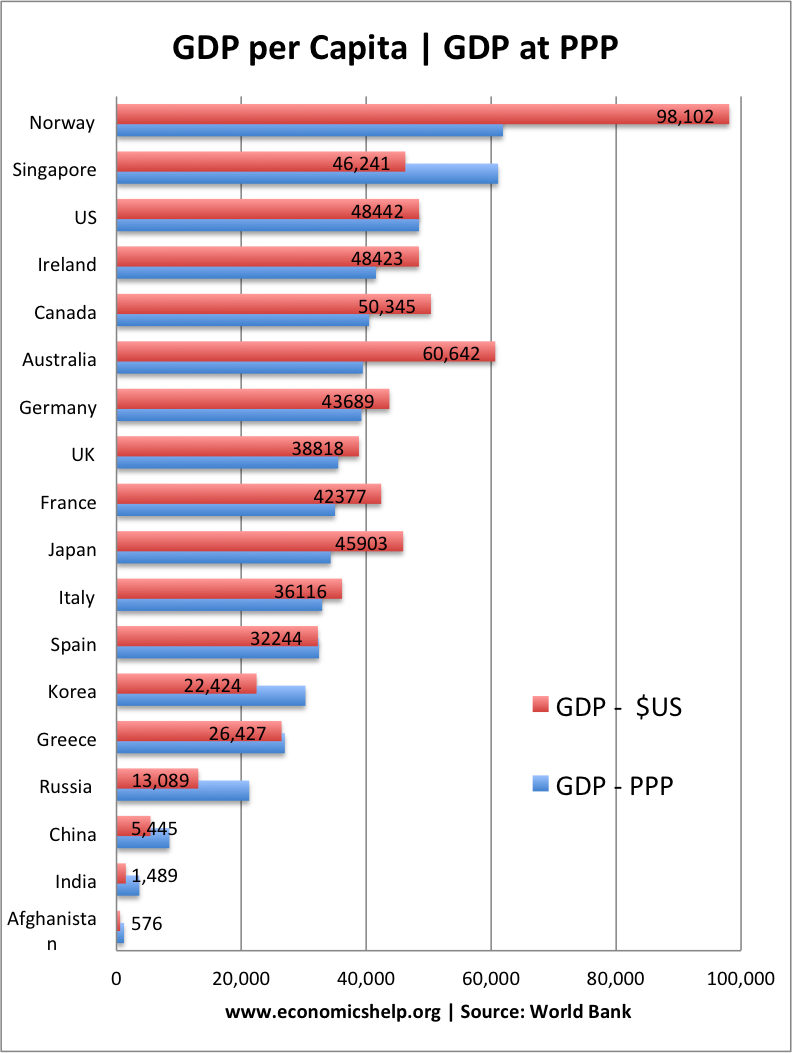
A look at how GDP per capita in $US gives different values when measured at purchasing power parity.

GDP at Purchasing Power parity (PPP) takes into account variations in living costs.
PPP is an attempt to work out how much currency will be needed to buy the same quantity of goods and services in different countries. If this can be done, it can show the underlying exchange rate between the two different countries and a more accurate reflection of actual living standards in countries.
Often exchange rates don’t actually reflect different living costs because some goods are not easily traded. For example, if you live in Norway, it is irrelevant if there is cheaper accommodation elsewhere in the world. What is important is how far your income goes in buying goods and services.
Norway v India
For example, GDP per capita in Norway is $98,102. However, in Norway the cost of living is much higher (higher VAT, higher wages, higher rents). Therefore, even if you have a salary of $98,102 – it doesn’t go as far as elsewhere in the world..
By comparison, in India, GDP per capita is $1,489 per year. However, in India, living costs are much lower and so that income goes much further. If we adjust for the relative cost of living in the different countries, the gap between India and Norway is much reduced.
- Using GDP per Capita in $US, Norway’s national income is 65 times higher than India.
- Using GDP per Capita adjusted for PPP, Norway’s national income is only 17 times higher than India.
So we get quite a different outlook.
GDP per capita in PPP is the most useful for comparing living standards. If your income increased £400 a month, but at the same time your rent increased by £400 – would you feel any better off? No.
| GDP – PPP | GDP – $US | |
| Afghanistan | 1,202 | 576 |
| India | 3,652 | 1,489 |
| China | 8,466 | 5,445 |
| Russia | 21,248 | 13,089 |
| Greece | 26,948 | 26,427 |
| Korea | 30,254 | 22,424 |
| Spain | 32,424 | 32244 |
| Italy | 32,928 | 36116 |
| Japan | 34,294 | 45903 |
| France | 34,993 | 42377 |
| UK | 35,494 | 38818 |
| Germany | 39,211 | 43689 |
| Australia | 39,438 | 60,642 |
| Canada | 40,440 | 50,345 |
| Ireland | 41,543 | 48423 |
| US | 48,442 | 48442 |
| Singapore | 61,103 | 46,241 |
| Norway | 61,882 | 98,102 |
Related
Purchasing Power Parity for exchange rates
Sources
GDP per Capita $US at World bank
GDP per capita at PPP at World Bank

2 thoughts on “GDP at PPP compared to GDP in $US”
Comments are closed.