I often like to tease my parents because they both now both qualify for free bus travel – one of the many ‘perks’ of being ‘old’. Half-jokingly I say they are the lucky generation. Buying a house in the 1960s, enabled a massive increase in wealth. They benefited from an era of full employment and greater relative job security. Neither went to university (so had no student loan to pay off ). But, in those days, a degree wasn’t so necessary (My Dad was last year to train as an accountant without even an A-level) 30 years later, with their mortgage paid off, their outgoings are relatively modest. Yet, despite the relative comfort of this generation, they are still entitled to a whole host of perks and benefits in kind from our ‘generous’ government.
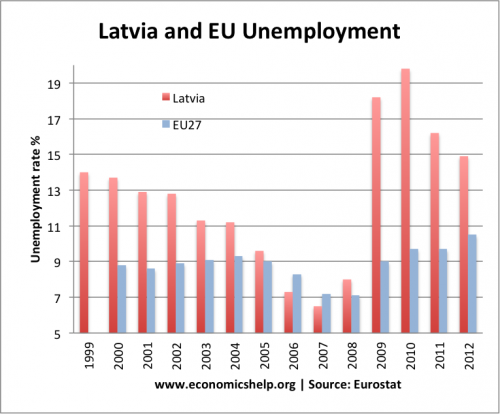
Compare that to the younger generation. Getting on the property ladder is very difficult – unless you are willing to take on excessive amounts of debt (probably to add to your student loans) The effect is that young people face high rents or high mortgage payments. Amongst young people, unemployment is very high. (18%) Those with jobs still face the harsher realities of the modern workforce – zero hour contracts, greater job insecurity and the very modern development of under-employment.
However, the baby boomers generation is quite politically powerful. Chancellors never seem to lose an opportunity to give more benefits to pensioners – free TV license, free bus pass, winter fuel discount. However, those who face unemployment and declining real wages, will see only rising living costs and little support. The costs of youth unemployment (both economic and social) are exceptionally high, but politically, there seems to be relatively little concern.
A recent report by the IFS show rising income disparity between the generations.
- The median – or middle – income of the over 60s grew by 2-3% between 2007/08 and 2011/12, continuing a long-term trend.
- Yet, the median income of people in their 20s fell by 12% over the same period, allowing for inflation. This was the largest fall of any age group, owing to low or frozen wages and high unemployment.
- According to dept of work and pensions 1 in 6 children now live in poverty.
The decline in pension poverty is very good and signs of social progress. But, maybe we should be giving free bus travel not to pensioners, but those who are unemployed or seeking a more permanent job.
Benefits in Kind
It is also important to bear in mind that income is only one factor that determines living standards. If you can live rent free (having paid off mortgage) and you also gain other free perks, that gives much greater security and discretionary income than having to pay a fortune for rent and paying off a student loan.