Wage growth is a key factor in determining living standards, aggregate demand and inflation. If wages increase faster than inflation, then households will be able to afford more goods and services. Real wage growth = nominal wage growth – inflation.
In the post-war period, apart from short-lived recessions, real wage growth has been positive, growing at a trend rate of roughly 2%
2008-14
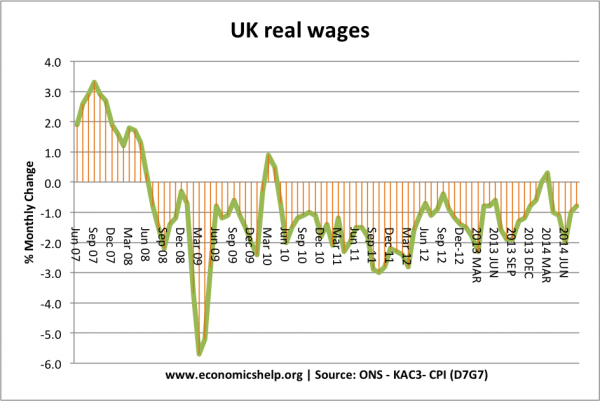
This period was one of the longest periods of falling real wages. It was due to:
- Great recession
- Depreciation in Pound Sterling, raising the price of imported goods
- Rise in cost of living through rising energy/food prices.
- Period of low-wage growth/low productivity
Research from the ONS stated that in 2012 real wages have fallen back to 2003 levels. (real wages fall)
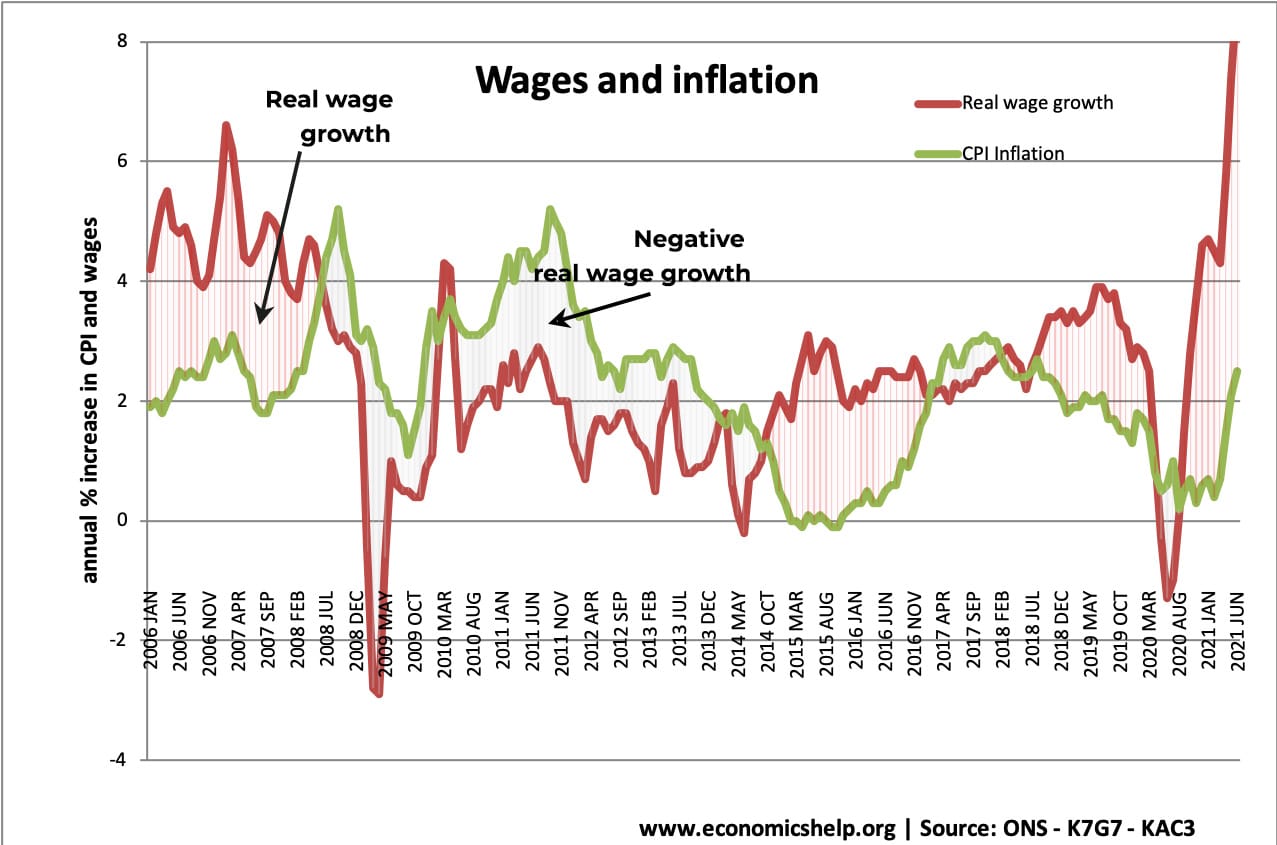
Between 2014 and 2016, inflation fell and wage growth picked up. This led to positive real wage growth. The first sustained growth in real wages since pre-2007.
However, this is being overturned by the depreciation of the Pound post-Brexit referendum and continued low growth in nominal wages.
2020 onwards
The covid shock to the economy has led to volatile wage growth. With wages falling at the start of the crisis. Though the UK recovery has seen a shortage of some workers and a rapid rise in wages in the recovery. However, this recovery in real wages has been hampered by record inflation in 2022, with CPI reaching 9% – above nominal wage growth.
Recent wage growth in UK
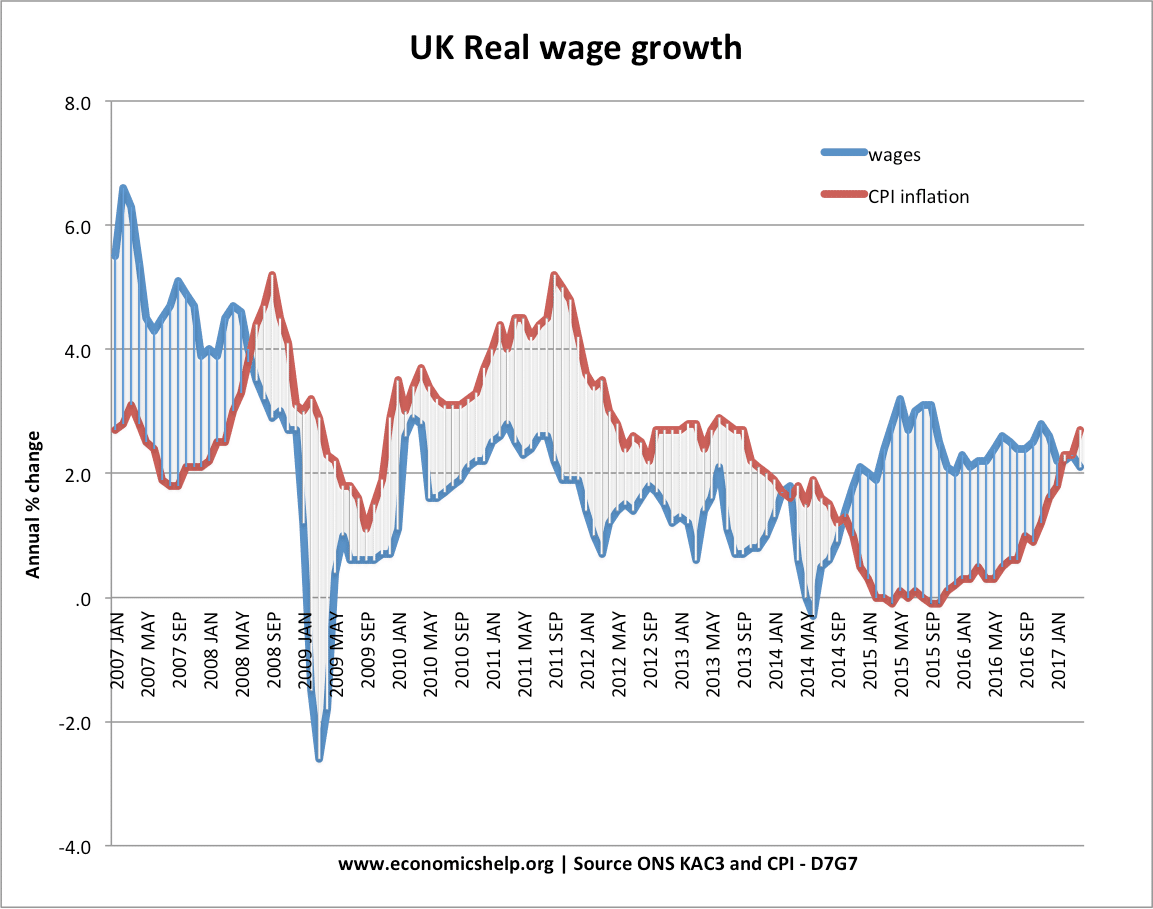
Source: wages KAC3 – ONS (average weekly earnings) – | CPI inflation (D7G7) ONS | UKEA
Until May 2008, wage growth was above inflation, causing positive real wage growth. But, since 2008, the UK has seen periods of negative real wage growth.
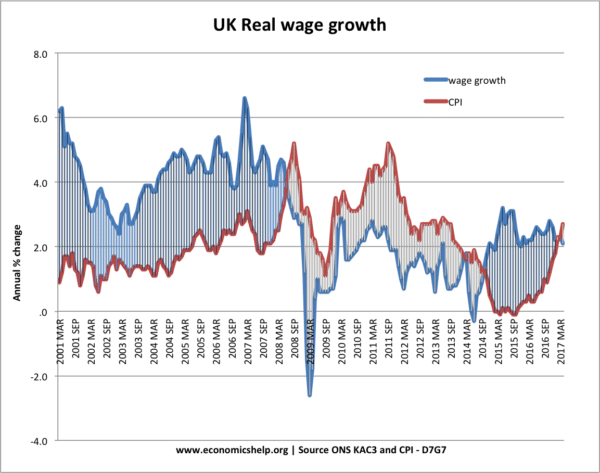
Wage growth since 2000
During the great moderation, we saw a steady period of rising real wages. This has been reversed since the prolonged recession of 2008 onwards.
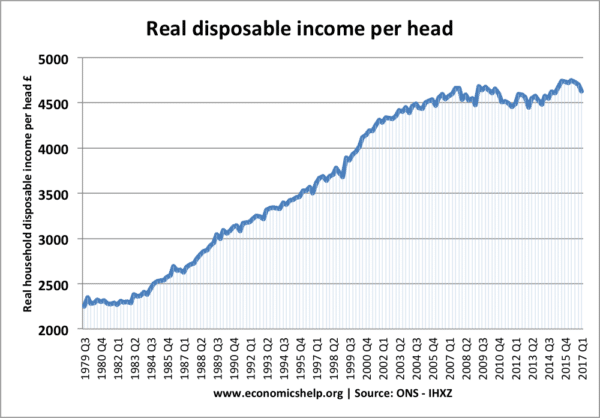
Real disposable income per head
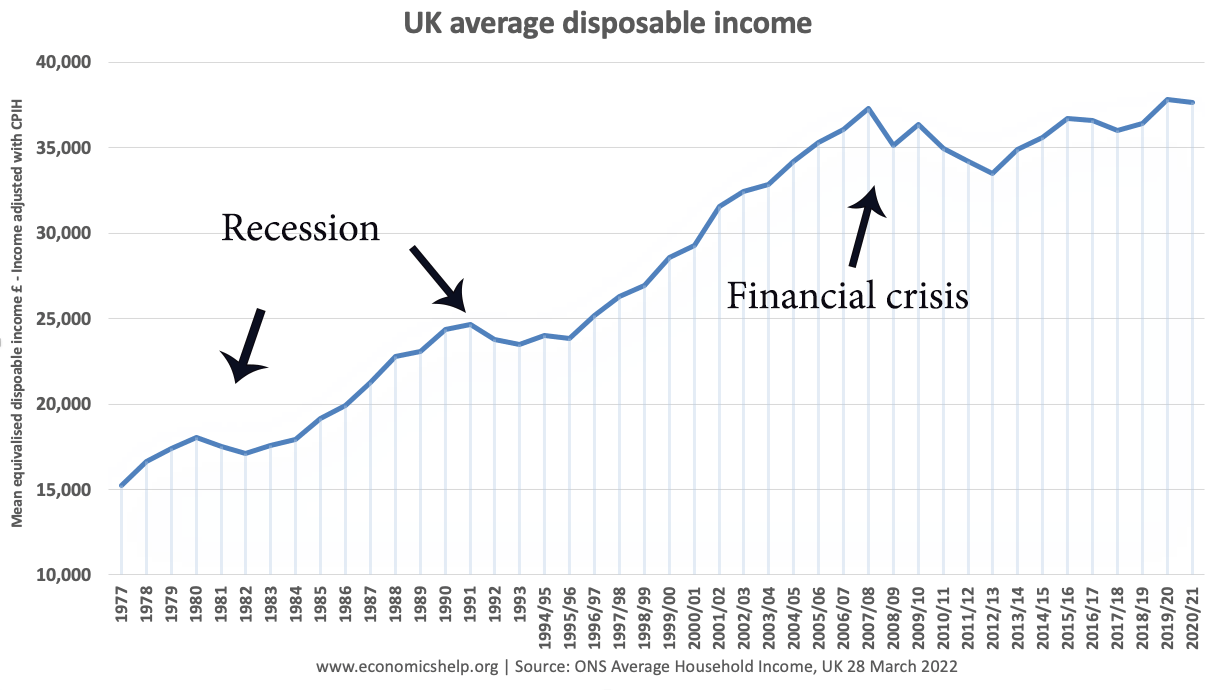
Real disposable income per head is income households have to spend after taxes and benefits. It is closely related to real wage growth but takes into account changes in taxes.
Source: ONS
Limited real income growth since 2009.
In 2007/08 real median disposable income was £37,310. By 2020/21 that was only a very small increase of £37,622 or less than 1% growth over 13 years.
Economic implications of recent wage trends
1. Muted inflationary potential. Some economists have worried that there is a risk of inflation from ultra-low-interest rates. During the great depression, we saw cost-push inflation, but this has evaporated because they were just temporary factors, such as rising oil prices, higher taxes e.t.c.
This shows the importance of wage growth for determining underlying inflationary trends. While wage growth remains low, there is muted potential for any long-term inflation.

