Trickle down economics

trickle-down-effect

Trickle down economics is a term used to describe the belief that if high-income earners gain an increase in salary, then everyone in the economy will benefit as their increased income and wealth filter through to all sections in society.

How the trickle-down effect may work in theory

trickle-down-effect

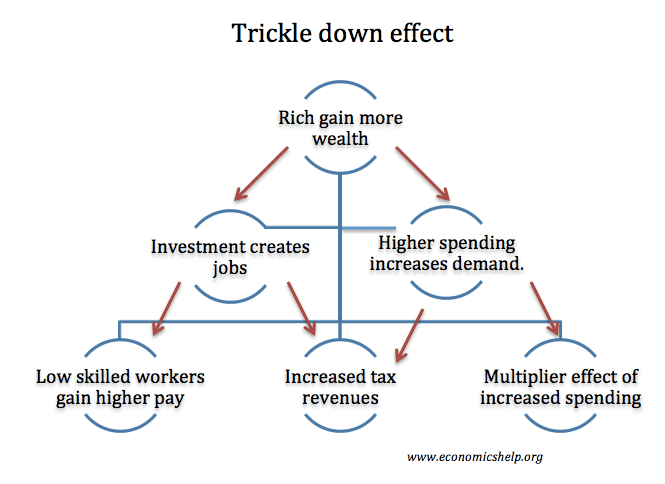
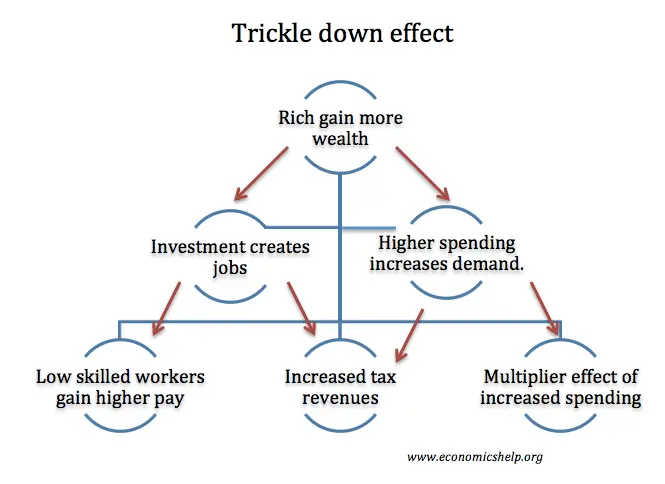
If the richest gain an increase in wealth, then

  • They will spend a proportion of this extra wealth.
  • The extra wealth will cause an increased demand for goods and services, causing higher employment and a rise in wages.
  • The higher wages will also cause a multiplier effect, e.g. if more chauffeurs are employed by the rich, the chauffeur will gain increased income and, in turn, they will increase spending in local businesses.
  • A cut in taxes increases the incentive to work. Lower income tax encourages people to work longer. Lower corporation tax encourages business to invest, creating wealth.
  • Alternatively, the wealthy may invest their increased wealth. If the wealth is invested in new businesses, it will create new jobs and increase the incomes of those employed.
  • Higher spending and investment will stimulate economic activity leading to a rise in tax revenues (higher income tax, higher VAT).
  • Higher tax revenues can fund public programmes such as healthcare, education and welfare payments to the poor.

Trickle-down effect and tax cuts

An important element of the trickle-down effect is with regard to income tax cuts for the top-income earners. It is argued that cutting income tax for the rich will not just benefit high-earners, but also everyone. The argument is as follows:

  1. If high-income earners see an increase in disposable income, they will increase their spending and this creates additional demand in the economy. This higher level of aggregate demand creates jobs and higher wages for all workers.
  2. Alternatively, increased profits for firms may be reinvested into expanding output. This again leads to higher growth, wages and incomes for all.
  3. Lower income taxes increase the incentive to for people to work leading to higher productivity and economic growth.
  4. The Laffer curve suggests cutting tax can even cause an increase in tax revenues as the lower tax rates are offset by higher growth.

A study by NBER June 1997 Engen and Skinner conclude that:

“cutting marginal tax rates across the board by 5 percentage points and cutting average tax rates by 2.5 percentage points would increase the growth rate of U.S. GDP by 0.3 percentage points per year.”

Video on Trickle-down economics

Criticisms of trickle-down economics

I have a joke about trickle-down economics. Only 99% of you will get it.

trickle-down-effect-criticism

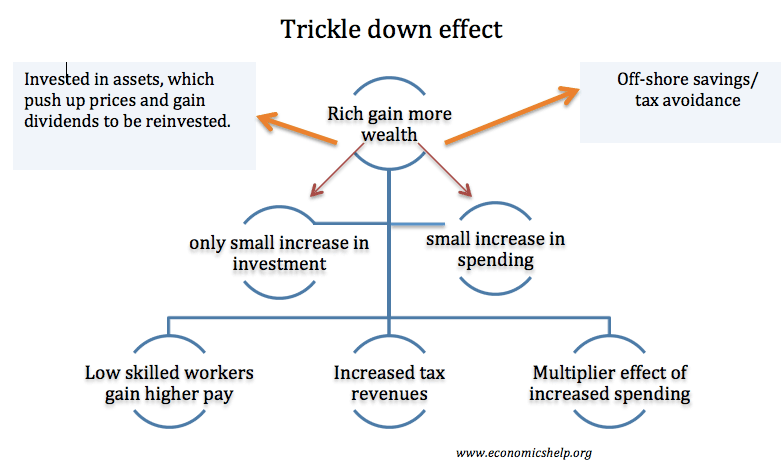
Many economists are sceptical of the belief in ‘the trickle-down’ effect. One reason, the wealthy have a higher marginal propensity to save, and also n recent years, wealth has been saved in off-shore accounts to avoid paying tax. Therefore, when the wealthy gain extra income, only a small percentage may filter through to low-income workers.

Also, some studies suggest that increased income inequality can lead to this inequality being solidified through educational opportunities, wealth accumulation and the growth of monopoly/monopsony power. Furthermore, increased inequality may lead to lower rates of economic growth.

Tax cuts have no clear impact on growth. In The Economic Consequences of Major Tax Cuts for the Rich (2020), by David Hope and Julian Limberg, the authors found tax cuts for the rich, had no statistical effect on economic growth. They looked particularly at the 1980s in UK and US, where significant taxes were cut.

“The results also show that economic performance, as measured by real GDP per capita and the unemployment rate, is not significantly affected by major tax cuts for the rich. The estimated effects for these variables are statistically indistinguishable from zero.” (LSE)

A report by the IMF (2015) found increasing income share of the poor increased economic growth, but increasing income share of the rich, led to lower growth.

“We find that increasing the income share of the poor and the middle class actually increases growth while a rising income share of the top 20 percent results in lower growth.”

Real GDP and Median wages in the US


real-median-incomes-gdp

In the US, real GDP has grown faster than median wages since the early 1980s. In the 1980s, taxes were cut for high earners and there was a significant increase in inequality. Proponents of the Reagan tax cuts and supply-side economics argue it was worth it because everyone benefitted from rising GDP. However, the median wage, (which is the wage the middle-income earners actually receive has increased slower than real GDP, suggested not all the gains of the top 1% have trickled down to average workers.

income-share-top-10%

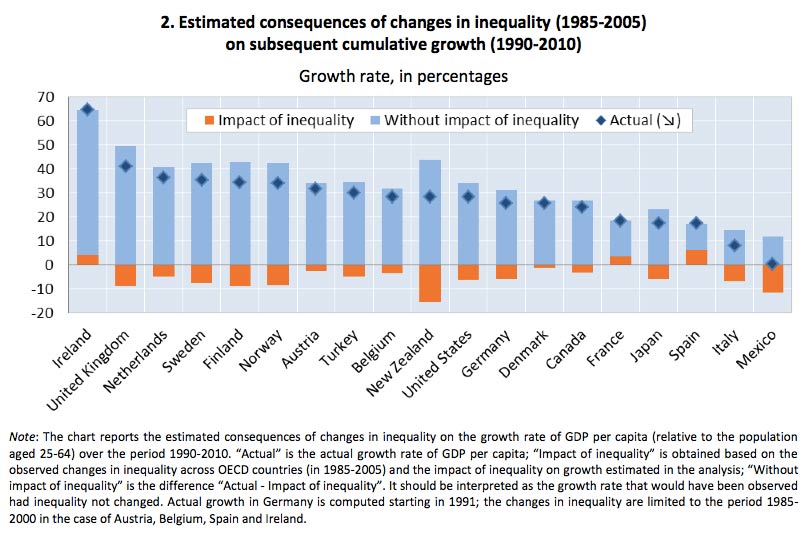
Inequality and lower growth. A recent report by the OECD found that since the start of the credit crisis in 2008, inequality has widened in many countries; however, this inequality has led to lower rates of economic growth not higher.

This graph from an OECD report suggests that inequality is responsible for lower GDP. The OECD estimates that the UK economy would have been more than 20% bigger had the gap between rich and poor not widened since the 1980s.

oecd-inequality Source: OECD Focus – Inequality and Growth 2014

Read more

Wealth Inequality in the UK

New statistics from the ONS, show that there are large disparities in wealth within the UK.  In 2010/12, aggregate total wealth of all private households in Great Britain was £9.5 trillion, (increasing from £9.0 trillion in 2008-10.

Some highlights from the report

  • The wealthiest 10% of households owned 44% of total aggregate household wealth.
  • The richest 1% have accumulated as much wealth as the poorest 55% of the population
  • The poorest 50% of the population only have 9% of total wealth.
  • Half of all households had total wealth of £218,400 or more.
  • In 2010/12 the wealthiest 20% of households had 105 times more aggregate total wealth than the least wealthy 20% of households. In comparison, in 2008/10 the wealthiest 20% of households had 92 times more aggregate total wealth than the least wealthy 20% of households.
  • The report doesn’t capture wealth in offshore havens.
  • The most wealthy group are those around retirement age (55-64), with no children.

Wealth inequality UK

Source: Wealth and Assets Survey – Office for National Statistics

Definition of wealth

Wealth is a stock of assets that an individual has at any particular time; this can be assets in the form of money, pension, shares or property. The ONS split wealth into four main categories

Total wealth net property wealth, net financial wealth, physical wealth and private pension wealth.

  • Property wealth – any property privately owned in the UK or abroad (£3.5tn 2012)
  • Physical wealth – Value of physical assets owned by a household, e.g. antiques, artworks, vehicles and personalised number plates. (£1.1tn 2012)
  • Financial wealth –  Net financial wealth is calculated by subtracting from financial asset values the value of any financial liabilities. (i.e.. savings – debt) (£1.3tn 2012)
  • Private pension wealth –The value of private pension schemes in which individuals can receive income from either now or in future. Private pension wealth was the largest component of aggregate total wealth. (£3.58tn 2012)

Facts about wealth inequality

  • 11% of households in UK owned other property than their main residence 2010/12
  • 24% of households had no private pension wealth in 2010/12
  • 25% of households had outstanding amounts on credit card debts
  • 7% of households had a personalised number plate
  • 48% of households had an individual savings account ISA.

Regional inequality

Regional wealth inequality

  • The average wealth of households in the South East had increased to £309,000 at the end of 2012, up 30% since 2006-8 –
  • The average rise in England was only 6%.
  • Wealth in the north-east had fallen to just under £143,000.
  • In Scotland, the average wealth is  £165,500
  • London had the biggest increase in household median wealth with a 31% increase.


 Lorenz curve for individual wealth components

wealth-components
Source: Wealth and Assets Survey – Office for National Statistics

The closer the curve is to the line the greater the equality of distribution. Financial wealth has the greatest degree of inequality.

This shows that the poorest 60% of households had negative financial wealth (debt greater than savings)

ONS report

Read more

Is the younger generation worse off than their parents?

Readers Questions: is this the worse time to be a young adult in the UK?

I will answer this question primarily from the economic point of view.

The first thought that springs to mind is that if you look at the long history of the UK, this is probably a good time to be young in the UK.

real-gdp-growth-55-14

Median incomes are close to an all time high (even despite the fall since since the 2008 crisis), educational opportunities are arguably better than before (even if more expensive), unemployment is relatively low and likely to fall (even if there is greater insecurity in the new job market).

It is always tempting to think that every thing was rosy in the past. But, living standards have consistently risen in the past few decades. It is true, that for the past five years, real incomes have stagnated even fallen, throwing into greater contrast rising living costs, especially housing. However, were the previous generation really better off?

Economic problems facing young people

There are several reasons to be concerned about prospects for young people.

Firstly, housing is a real problem. There is a serious shortage of affordable housing – especially in London and the south. This means that many young people simply can’t afford to buy a house like their parents generation could. Home ownership rates are falling – especially amongst people under 30.

house-price-income

House prices are rising faster than incomes. See more at UK housing market stats – including house price to income ratios. For many young people, buying a house is just an impossibility.

Read more

Wages Declining as a Share of National Income

The ILO recently produced their growth and wages report for 2012/13. This suggested that across the developing world, labour markets are being characterised by falling real wages and a decline in labour’s share of national income. In particular:

  • Real wage growth has been flat – even negative in the past few years.
  • There is an increasing gap between productivity growth and wage growth. Wages are not rising along with productivity.
  • Wages are becoming a smaller share of national income.
  •  In 16 developed economies, labour took a 75% share of national income in the mid-1970s, but this has dropped to 65% in 2007.  It rose in 2008 and 2009 – but only because national income itself shrank in those years – before resuming its downward course. (Wages in developed world shrink at Guardian)

Real Wage Growth

real-wage-growth-world

It is common to refer to the low wages of China, but wages in China have roughly tripled in the past decade – meaning China has one of best wage growth rates in the world.

However, if we look at just developed economies, we see even lower wage growth.

Real Wage Growth – developed economies

real-wage-growth-developed-economies

The global credit crisis has also resulted in increased inequality. Wage income is declining as a share of overall national output. Improvements in labour productivity are not being matched by real wage growth. This graph below shows the increased divergence between wage growth and productivity.

Read more

Item added to cart.
0 items - £0.00