Example of plotting demand and supply curve graph

The demand curve shows the amount of goods consumers are willing to buy at each market price. An individual demand curve shows the quantity of the good, a consumer would buy at different prices.     Plotting price and quantity supply     Market equilibrium     More demand curves Related Factors affecting demand Demand …

Read more

J-Curve Effect

j-curve-effect

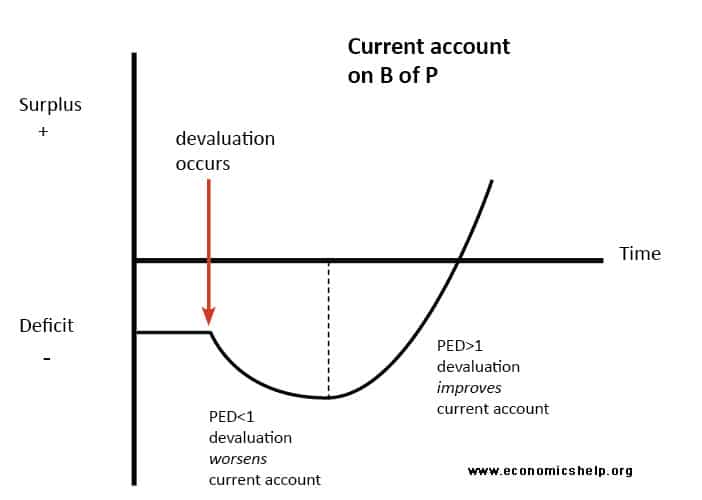
The J Curve effect a depreciation in the exchange rate can cause a deterioration of the current account in the short-term (because demand is inelastic). However, in the long-term, demand becomes more price elastic and therefore, the current account begins to improve. The J-Curve is related to the Marshall-Lerner condition, which states: If (PED x …

Read more

Demand curve formula

change-in-a-demand-curve-equation

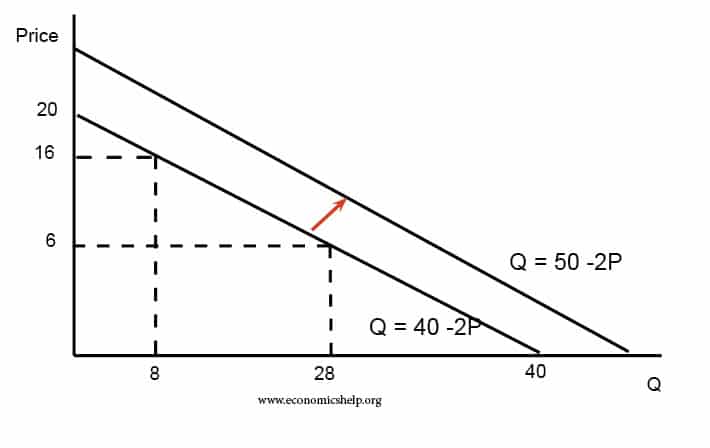
The demand curve shows the amount of goods consumers are willing to buy at each market price. A linear demand curve can be plotted using the following equation. Qd = a – b(P) Q = quantity demand a = all factors affecting QD other than price (e.g. income, fashion) b = slope of the demand …

Read more

Indifference curves and budget lines

indifference-curve

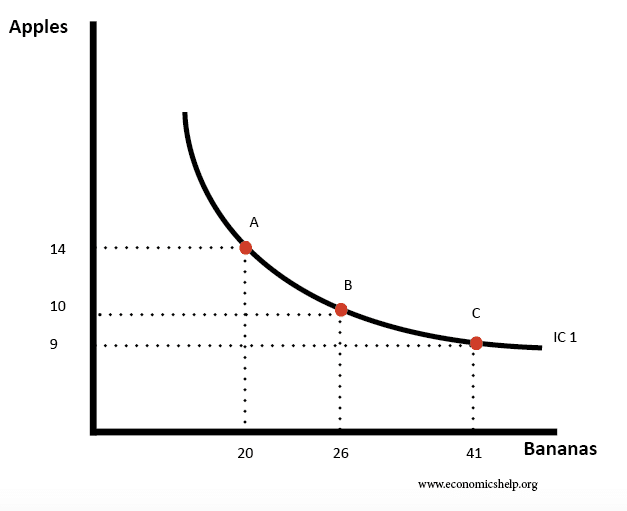
An indifference curve is a line showing all the combinations of two goods which give a consumer equal utility. In other words, the consumer would be indifferent to these different combinations. Example of choice of goods which give consumers the same utility Table plotted as indifference curve Diminishing marginal utility The indifference curve is convex …

Read more

The Laffer Curve

laffer-curve-2018

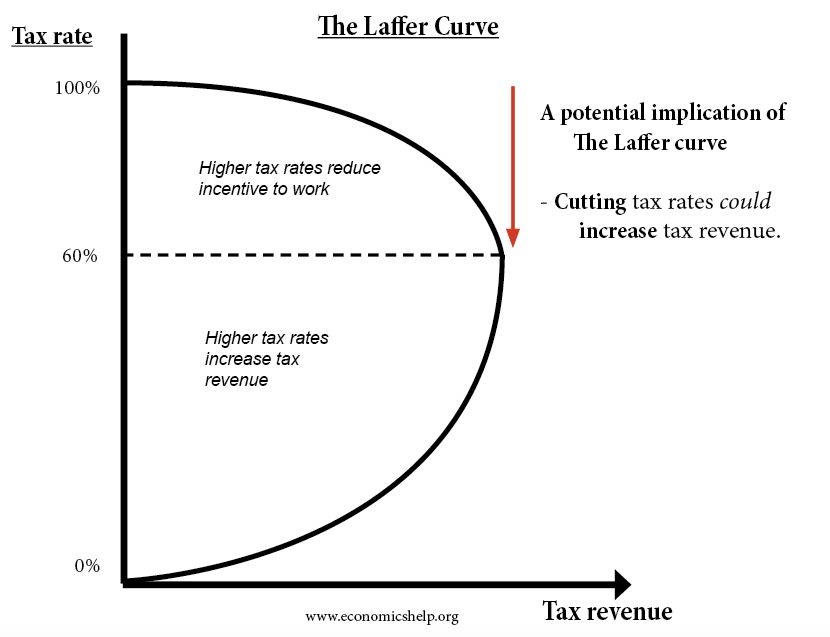
The Laffer Curve states that if tax rates are increased above a certain level, then tax revenues can actually fall because higher tax rates discourage people from working. Equally, the Laffer Curve states that cutting taxes could, in theory, lead to higher tax revenues. It starts from the premise that if tax rates are 0% …

Read more

The Rahn Curve – economic growth and level of government spending

rahn-curve

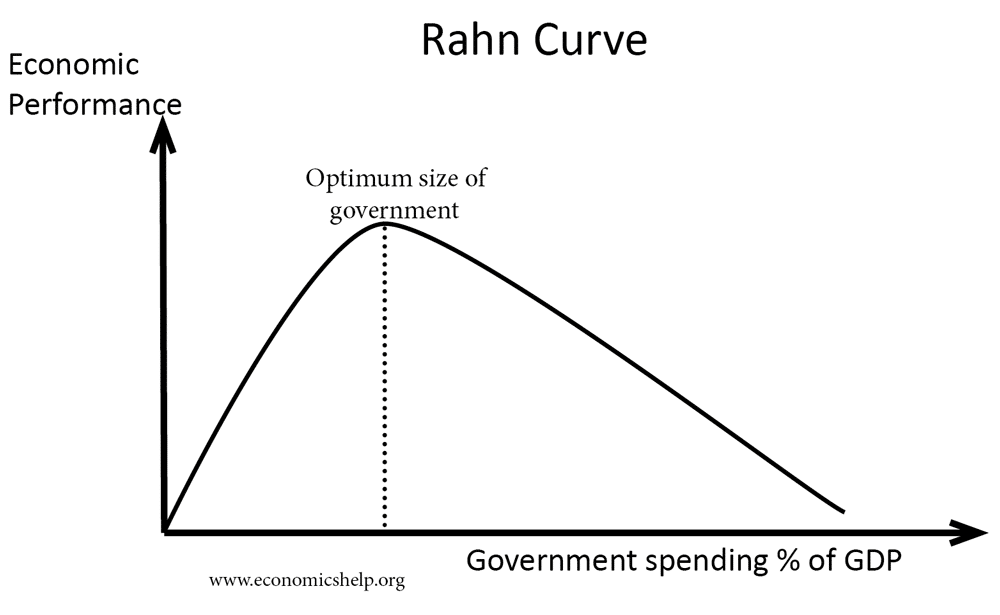
Readers Question: Does the Rahn Curve support the empirical evidence? If not, why not? Can you prove that there is a relationship between the level of Government Spending and GDP growth? The Rahn Curve suggests that there is an optimal level of government spending which maximises the rate of economic growth. Initially, higher government spending …

Read more

Why is the aggregate demand (AD) curve downward sloping?

ad-downward-sloping

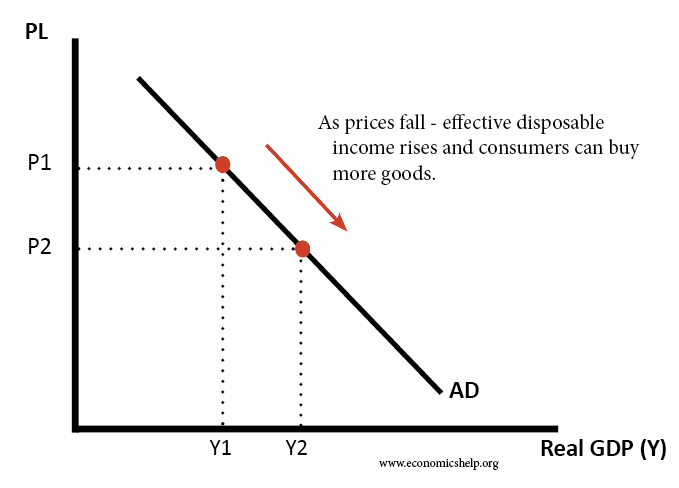
The aggregate demand curve (AD) is the total demand in the economy for goods at different price levels. AD = C + I + G + X – M If there is a fall in the price level, there is a movement along the AD curve because with goods cheaper – effectively, consumers have more …

Read more

Item added to cart.
0 items - £0.00