Phillips Curve Explained

phillips-curve2

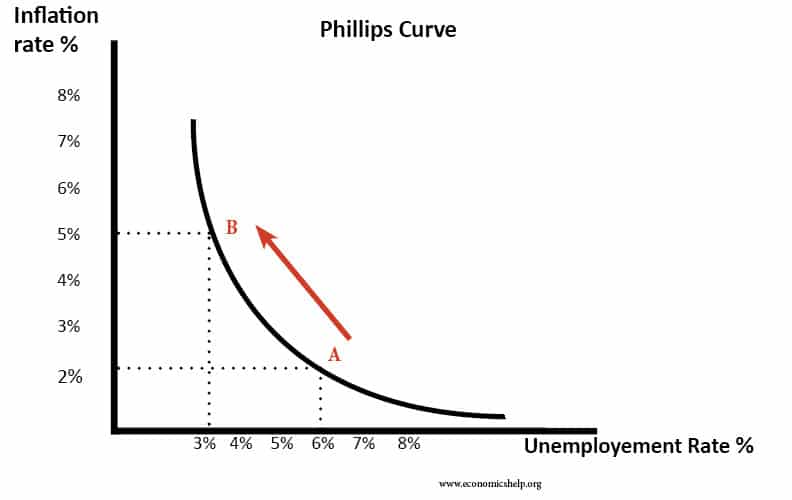
Summary of Phillips Curve The Phillips curve suggests there is an inverse relationship between inflation and unemployment. This suggests policymakers have a choice between prioritising inflation or unemployment. During the 1950s and 1960s, Phillips curve analysis suggested there was a trade-off, and policymakers could use demand management (fiscal and monetary policy) to try and influence …

Read more

Which view of Phillips Curve is correct?

phillips-curve2

The original Phillips curve suggested there was a trade-off between nominal wages and unemployment. Higher demand led to rising wages and a fall in unemployment. Lower aggregate demand (AD) led to a fall in nominal wages, but a rise in unemployment. This was adapted to suggest a trade-off between unemployment and inflation. During the 1950s …

Read more

Is Phillips Curve still Relevant?

phillips-curve2

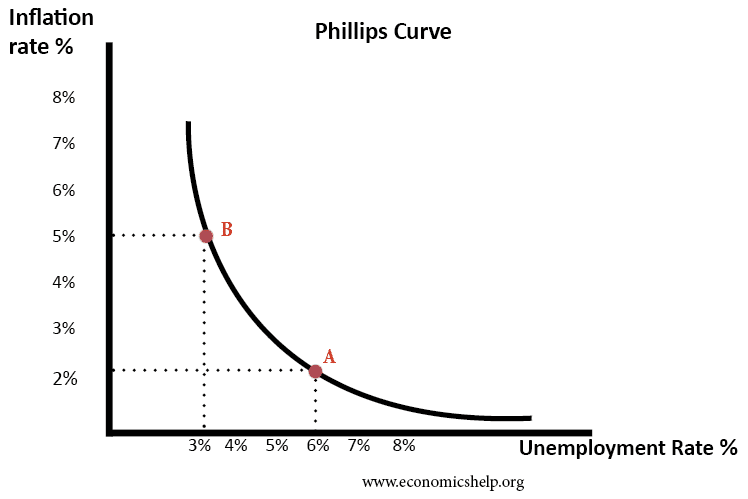
Readers Question Discuss the view that the Phillips Curve is irrelevant in explaining the relationships between unemployment and inflation in the UK. The standard Phillips curve suggests there is a trade-off between unemployment and inflation. This relationship occurs because of the Keynesian view of the AD/AS diagrams. Diagram showing an increase in AD As AD …

Read more

Unemployment

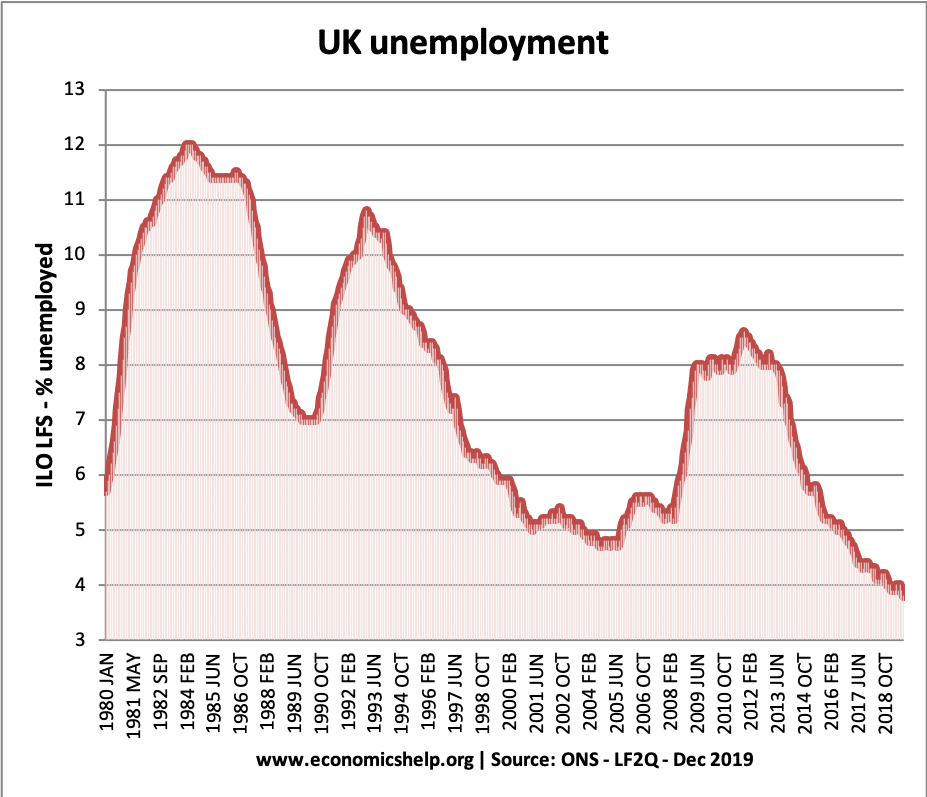
Definitions of Unemployment Unemployment Rate. This is the % of people in the labour force without a job but  registered as being willing and available for work Labour Force  Those people holding a job or registered as willing and able to work Therefore this is the number employed plus number unemployed (but actively seeking work) …

Read more

Item added to cart.
0 items - £0.00