Current UK Inflation Rate


- CPI inflation rate: 2.3% (headline rate) CPI – D7G7 at ONS
- Source: Raw data General inflation tables | CPI annual % change D7G7 at ONS
Other measures of inflation
- (CPIH) CPI including owner occupiers’ housing costs – 6.2% (CPIH – L550)
- See: Measures of inflation
Reasons for low inflation in the UK until 2021
- Low worldwide inflationary expectations. Europe is experiencing very low rates of inflation.
- Fall in global inflation rates since 2007.
- Reduced consumer spending due to Covid downturn
- Weaker commodity price growth.
Reasons for surge in inflation during 2022
- Rising oil prices
- Rising gas prices
- Ukraine war disrupting gas/energy and food supplies.
- Lingering supply side issues from Covid lockdowns and impact on price of shipping.
Inflation trends in the UK
Despite temporary cost-push inflationary factors in 2017, underlying inflationary pressures remain muted – at least compared to the past four decades.
The current UK inflation rate compares favourably to much of the post-war period.
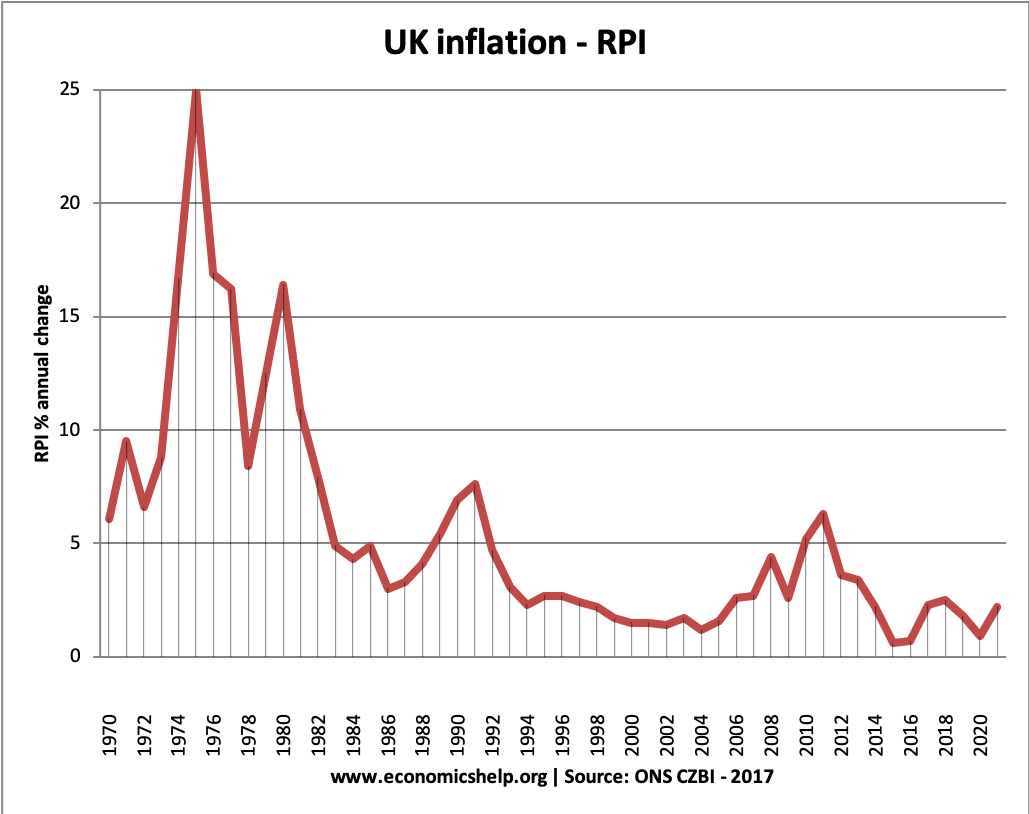
1970s Inflation
The 1970s frequently saw double-digit inflation. This was due
- Cost-push factors – rapid rise in oil prices
- Rising wages due to powerful trade unions trying to keep up with living costs.
- Lack of independent monetary policy
- Inflation expectations rose
Late 1980s inflation
The inflation of the late 1980s was due to
- Rapid economic growth ‘The Lawson Boom‘ – growth was above the trend rate causing supply shortages
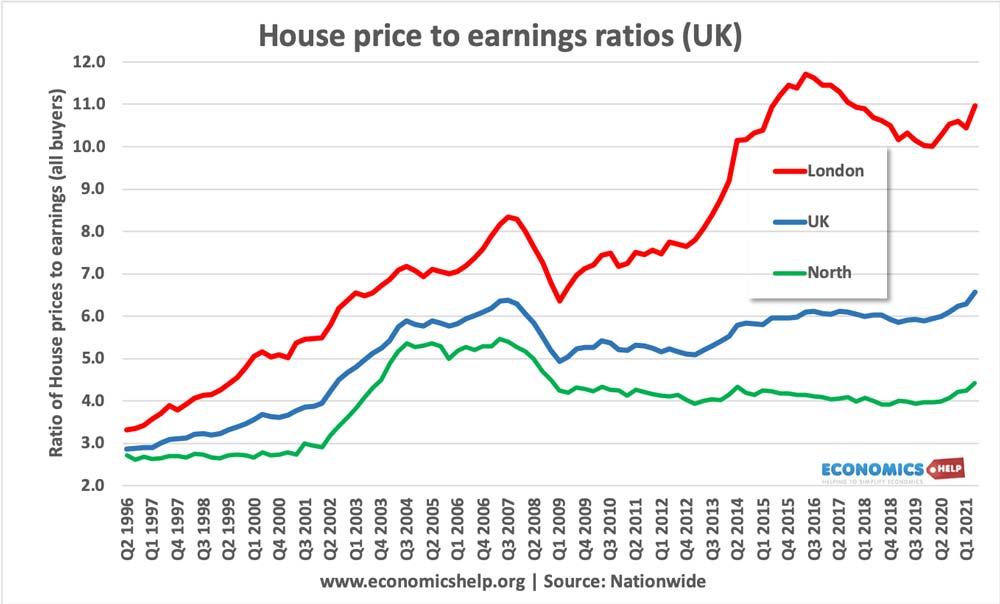
- Rise in house prices fuelling wealth effect
- Lack of independent monetary policy. The policy was partly set by ‘shadowing the D-Mark’ which led to loose monetary policy in late 1980s
Inflation and wages
- Real wages = nominal wages – inflation.
- Usually, during a period of economic growth – wage growth is higher than inflation, this leads to positive real wage growth.
- During the economic recession of 2009-13 – we had a prolonged period of negative real wage growth. Wages rising at a slower rate than inflation.
- The end of 2014 saw the first signs of renewed wage growth and positive real wage growth.

Since 2008, there has been an unusual period of negative real wage inflation. (inflation higher than wage growth)
However, since the recovery from the Covid downturn, there has been a sharp increase in wages (likely to prove temporary)
See more at UK wage growth
Inflation since 1990
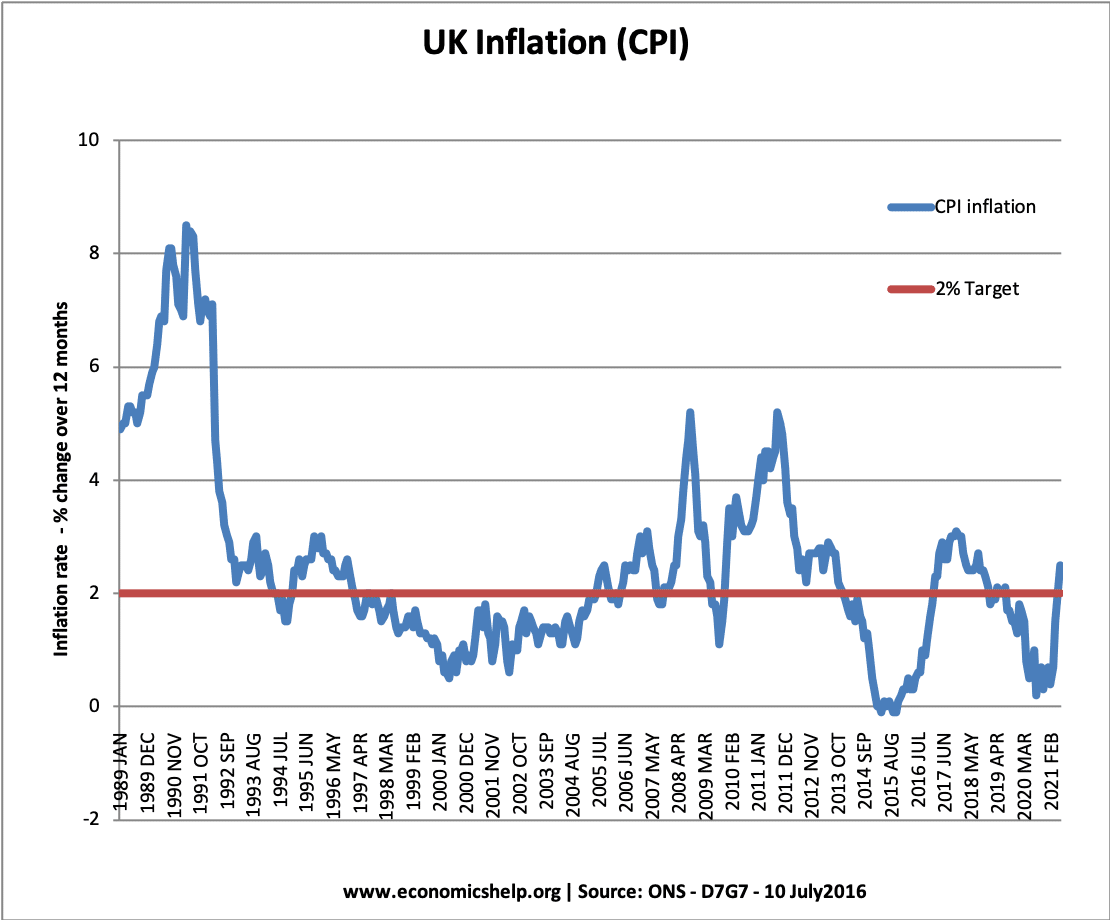
- Inflation rose over 8% in the late 1980s due to the Lawson boom, which was a period of unsustainable economic growth.
- Inflation was low in the period 1992 to 2007. This was a period known as the ‘great moderation’
- The inflation of 2008 and 2012 was due to cost-push factors (devaluation and rising commodity prices)