Suppose a monopolist sells in a market with a demand curve
p = a – bQ where p is price, Q is output and a = 25 and b = 2.
The monopolist needs to replace its existing plant and machinery and has two choices. The first option is to spend $40 and produce at a constant marginal cost of $5. The second option is to invest $20 and produce at a constant marginal cost of $9.
(i) Derive the monopolist’s profit maximising price, output volume and profit.
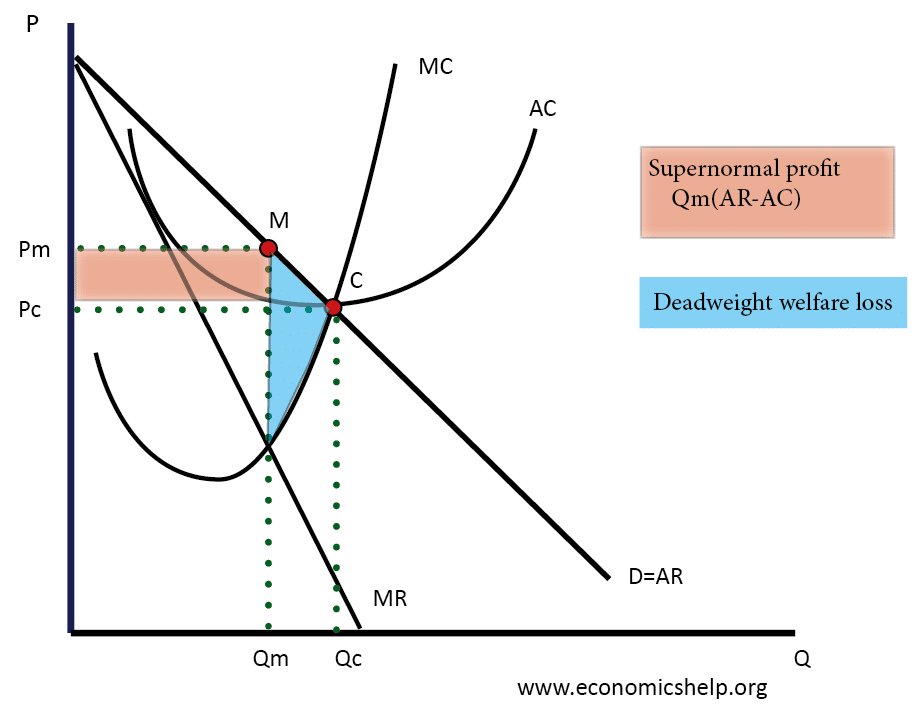
Profit Maximisation occurs where TR – TC is the greatest
“ also occurs at an out put where MR = MC
because When MR> MC Total Profit is increasing.
But when MR< MC TOTal Profit is falling
as shown in the diagram of MR and MC

Diagram for Monopolist to Maximise profit
Formula for Monopoly Profit Maximisation
P = a – bQ
P = 25 – 2Q so Q = 12.5 – 0.5P
AR = 25 – 2Q
( To derive the MR
ΔTR = pΔQ + QΔP
MR = ΔTR/ ΔQ
MR = P + Q ΔP/ΔQ
Noting that –b = ΔP/ΔQ (= The slope of the demand curve)
MR = P + Q. ΔP/ΔQ
= a – bQ + Q(-b)
= a – 2bQ
The important thing is that MR = a – 2(bQ) This is because the MR is twice as steep as the AR
Therefore MR = 25 – 4Q
OPTION ONE MC = $5 & SPEND $40
1. MR= MC
25 –4 Q = 5
so Q = 5
using P = a-bQ
P = 25 – 2*5
So P =15
Profit = Total Revenue – Total Cost (where Total Cost = FC +VC(Q*MC))
= 5*15 – (40 + 5*5)
= 75 – (40 + 25)
= 75 – 65
π = $10
Thus at an output of 5 and Price of $15 the maximum profit is $10
OPTION TWO MC = $9 & INVEST $20
2. MR= MC
25 –4 Q = 9
so Q = 4
using P = a-bQ
P = 25 – 2*4
So P =17
Profit = Total Revenue – Total Cost (total Cost = FC +VC(Q*MC))
= 4*17 – (20 + 4*9)
= 68 – (20 + 36)
= 68 – 56
π = $12
Answer = OPTION TWO
The answer to the above is to go for the second option which is to invest $20 and produce at a constant margin of $9 as this gives the higher profit per unit at $12, instead of the first option which only gives profit at $10 per unit.