New statistics from the ONS, show that there are large disparities in wealth within the UK. In 2010/12, aggregate total wealth of all private households in Great Britain was £9.5 trillion, (increasing from £9.0 trillion in 2008-10.
Some highlights from the report
- The wealthiest 10% of households owned 44% of total aggregate household wealth.
- The richest 1% have accumulated as much wealth as the poorest 55% of the population
- The poorest 50% of the population only have 9% of total wealth.
- Half of all households had total wealth of £218,400 or more.
- In 2010/12 the wealthiest 20% of households had 105 times more aggregate total wealth than the least wealthy 20% of households. In comparison, in 2008/10 the wealthiest 20% of households had 92 times more aggregate total wealth than the least wealthy 20% of households.
- The report doesn’t capture wealth in offshore havens.
- The most wealthy group are those around retirement age (55-64), with no children.
Source: Wealth and Assets Survey – Office for National Statistics
Definition of wealth
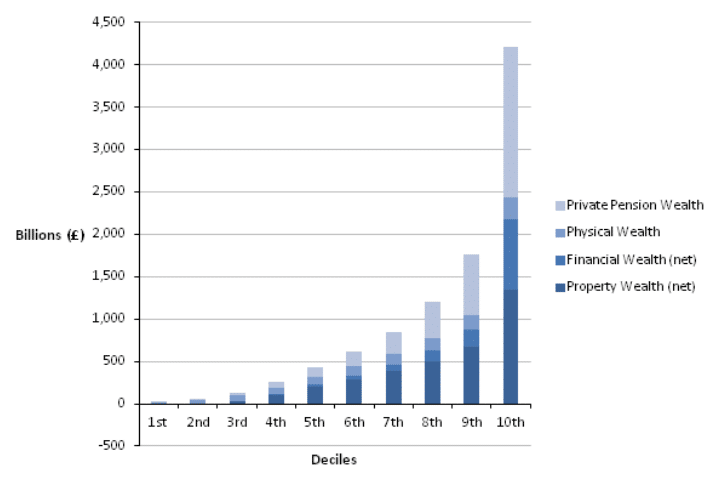
Wealth is a stock of assets that an individual has at any particular time; this can be assets in the form of money, pension, shares or property. The ONS split wealth into four main categories
Total wealth net property wealth, net financial wealth, physical wealth and private pension wealth.
- Property wealth – any property privately owned in the UK or abroad (£3.5tn 2012)
- Physical wealth – Value of physical assets owned by a household, e.g. antiques, artworks, vehicles and personalised number plates. (£1.1tn 2012)
- Financial wealth – Net financial wealth is calculated by subtracting from financial asset values the value of any financial liabilities. (i.e.. savings – debt) (£1.3tn 2012)
- Private pension wealth –The value of private pension schemes in which individuals can receive income from either now or in future. Private pension wealth was the largest component of aggregate total wealth. (£3.58tn 2012)
Facts about wealth inequality
- 11% of households in UK owned other property than their main residence 2010/12
- 24% of households had no private pension wealth in 2010/12
- 25% of households had outstanding amounts on credit card debts
- 7% of households had a personalised number plate
- 48% of households had an individual savings account ISA.
Regional inequality
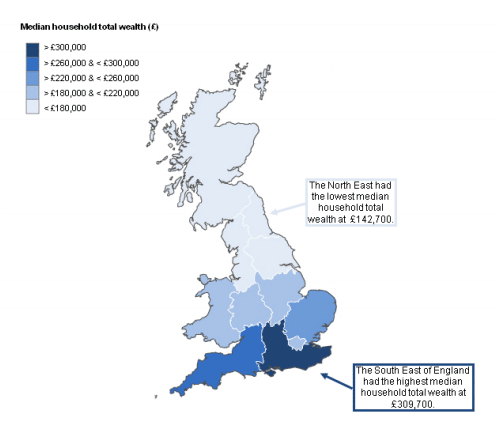
- The average wealth of households in the South East had increased to £309,000 at the end of 2012, up 30% since 2006-8 –
- The average rise in England was only 6%.
- Wealth in the north-east had fallen to just under £143,000.
- In Scotland, the average wealth is £165,500
- London had the biggest increase in household median wealth with a 31% increase.
Lorenz curve for individual wealth components
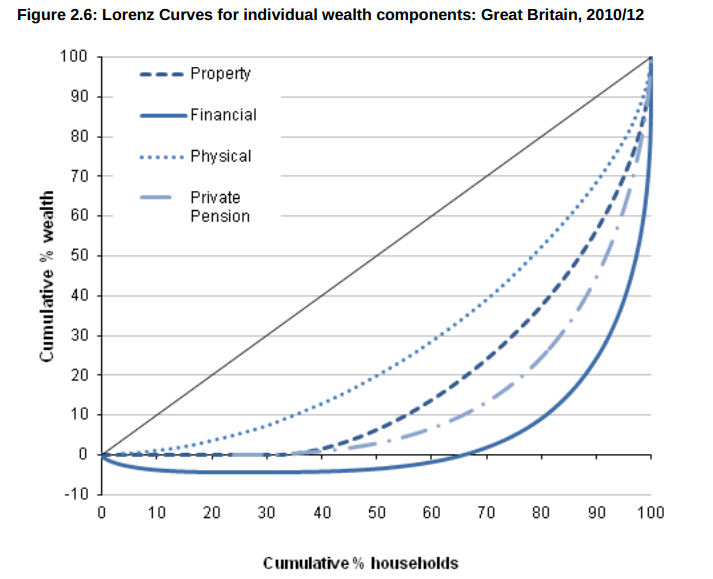
The closer the curve is to the line the greater the equality of distribution. Financial wealth has the greatest degree of inequality.
This shows that the poorest 60% of households had negative financial wealth (debt greater than savings)

- UK wealth. Source: UK Communities – housing wealth pdf
Reasons for wealth inequality in the UK
- Pension inequality. In recent years, richer households have been able to increase their private sector pension contributions. (Private pension wealth makes the largest contribution to total wealth for the wealthiest 30 per cent of households.) The increased importance of pensions has occurred despite poor stock market returns reducing the value of some pensions and asset trusts.
- Property Prices.
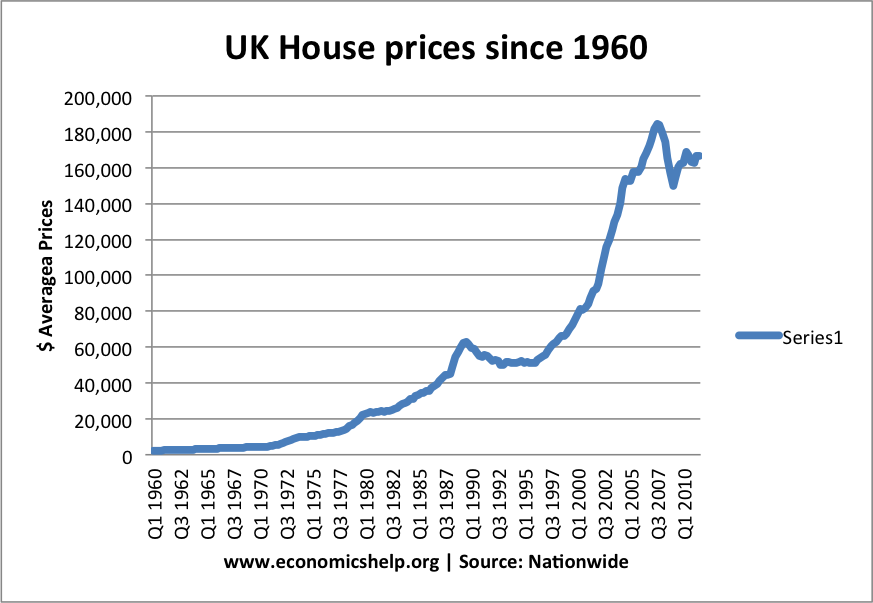
Since the 1960s, UK house prices have increased much faster than the rate of inflation. Property owners have seen a marked increase in household wealth through rising property prices. This has increased the gap between property owners and non-property owners. This has also been exacerbated by the growth of second homes and buy to let which enables households to develop a property portfolio. - Ability to save. People on low income rarely have the ability to save. They have a very high marginal propensity to consume. People on higher incomes have a lower marginal propensity to consume, after buying necessities, they have an ability to save (e.g. for private pensions and personal savings account.

Source: BBC - Increased income inequality. Since the 1970s, there has been a widening of income inequality. This has contributed towards greater wealth inequality. See also: rising income inequality
- Thomas Piketty in his book Capital in the Twenty-First Century has argued that the rate of returns on capital (property, asset investment) has consistently been greater than the returns from economic growth. This means that returns from wealth is greater than growth in real incomes. This causes wealth inequality to widen, and he notes it has been a feature across the developed world in the past 20 years.
Wealth Inequality in London
Wealth inequality varies throughout different regions. Because London property prices are higher than the national average then wealth inequality is much greater in the capital. According to In Injustice: Why Social Inequality Persists published by Policy Press, Danny Dorling.
In the capital the top 10% of society had on average a wealth of £933,563 compared to the meagre £3,420 of the poorest 10% – a wealth multiple of 273. (London’s richest)
Impact of Wealth Inequality
In 2008, a female born in London’s exclusive Kensington and Chelsea could expect to live until 88 and nine months – a year earlier she would have reached 87.9. In Glasgow, by contrast, where women were expected to live until 77.1 In 2007, the rise was only a month to 77.2 in 2008.
Definition of Financial Wealth
- Net financial wealth = gross financial wealth – financial liabilities.
- Gross financial wealth is the sum of formal financial assets (not including current accounts in overdraft) + informal financial assets held by adults + children’s assets + endowments for the purpose of mortgage repayment.
- Financial liabilities are the sum of arrears on consumer credit and household bills + personal loans and other non-mortgage borrowing + informal borrowing + overdrafts on current accounts.
Related
this is an absolute mazza, if only “oh” Jeremy Corbyn came in the we could do something about all these footballers and chealsea truckers turning this country into a terrible place based around “insta” and “yeezy boots”… Terrible and Shocking