A concise definition of economics
Economics is the study of how to deal with the problem of scarcity and opportunity cost of decisions.
Economics is concerned with the optimal distribution of scarce resources in particular
- What to Produce?
- How to Produce?
- Whom to Produce?
To this end, economists investigate economic decisions made by individuals, firms and governments.
For example, economics considers the effect of increasing income tax and the government spending money on education and health care.
Economics is part science, part art. It combines elements of science but has too many variables and uncertainties to be a pure science.
“The ideas of economists and political philosophers, both when they are right and when they are wrong are more powerful than is commonly understood. Indeed, the world is ruled by little else. Practical men, who believe themselves to be quite exempt from any intellectual influences, are usually slaves of some defunct economist.”
―
Branches of Economics
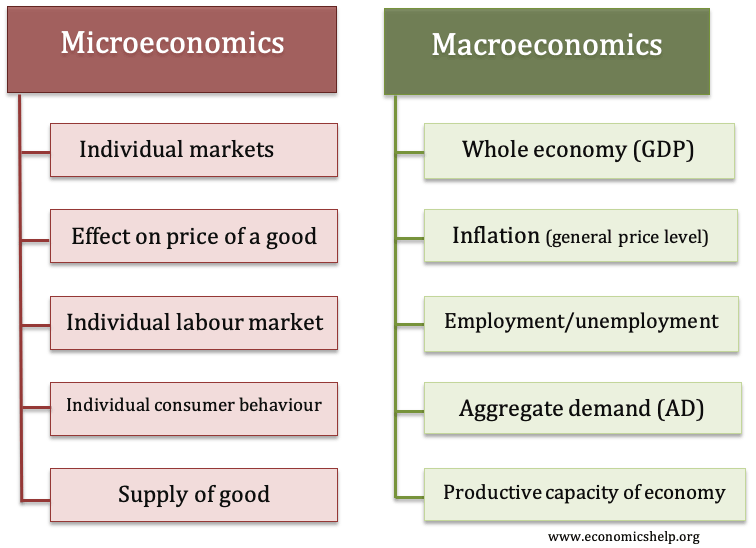
- Micro Economics – the study of aspects of the economy, consumers, firms, particular goods.
- Macro Economics – the study of the whole economy, angles such as economic growth and inflation.