The unadjusted labour share is usually calculated as the ratio of total compensation of employees – wages and salaries before taxes, plus employers’ social contributions – over GDP (national product/income) (Luebker, 2007).
There are different methodologies for calculating labour share – e.g. should executive pay and share options be included? Greater insight would be gained by seeing median wages as a share of GDP or excluding the top 1% of income earners – who have seen rising income in recent years. Nevertheless, even unadjusted labour shares give an idea about the relative distribution of income.
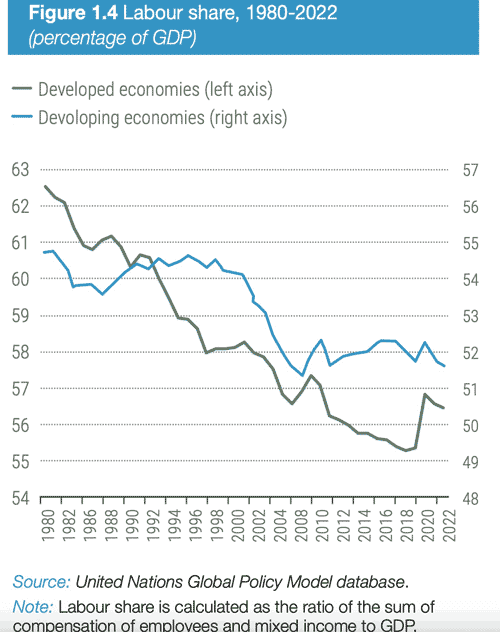
Labour share as % of GDP has fallen around the world, but the biggest drop is in developed economies.
Importance of Labour share of income
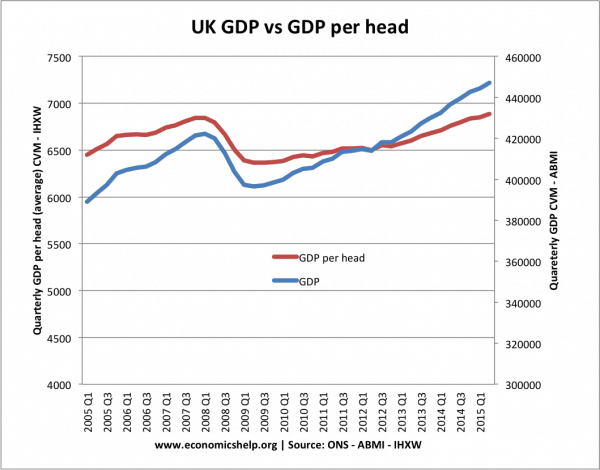
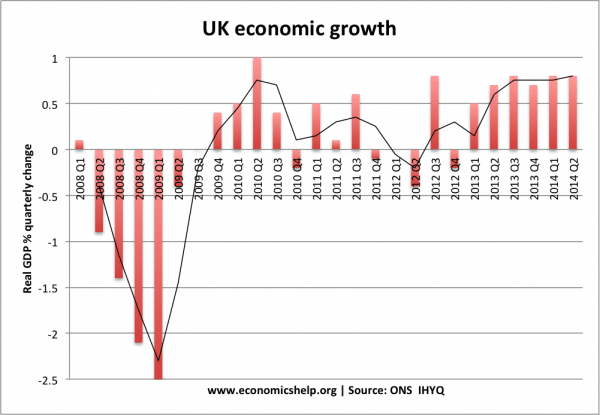
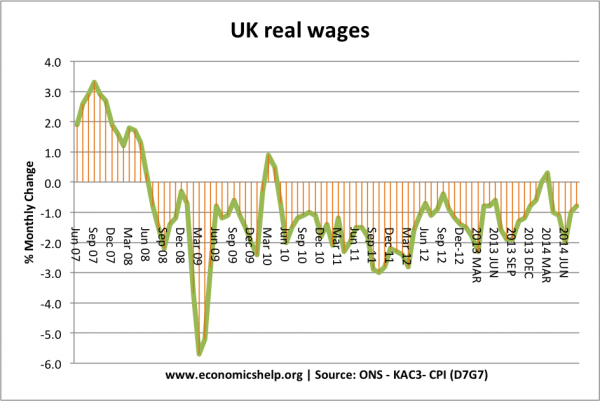
In recent years, the UK has seen rising real GDP, but stagnant real wage growth. This has been due to:
- Population growth – real GDP per capita increasing at slower rate than real GDP
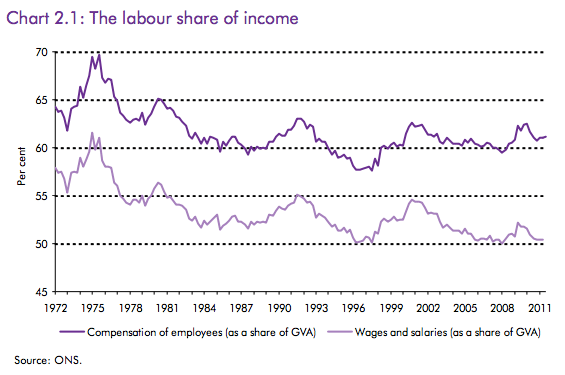
- Labour share of income – wages and salaries are taking a smaller share of GDP. Profit and dividends are taking a bigger share of GDP.
I found this graph from Budget and Responsibility
Long-term Labour share UK
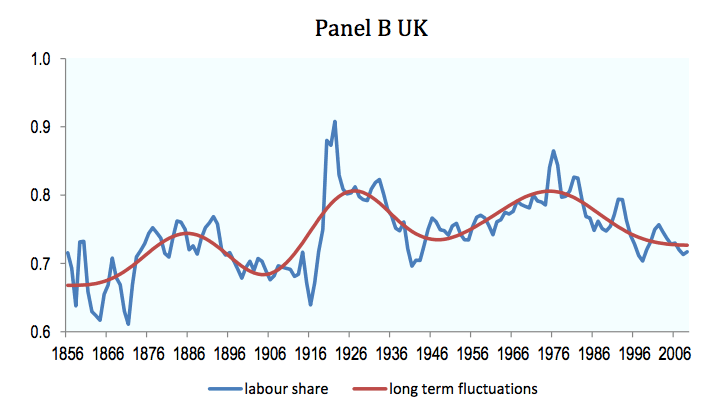
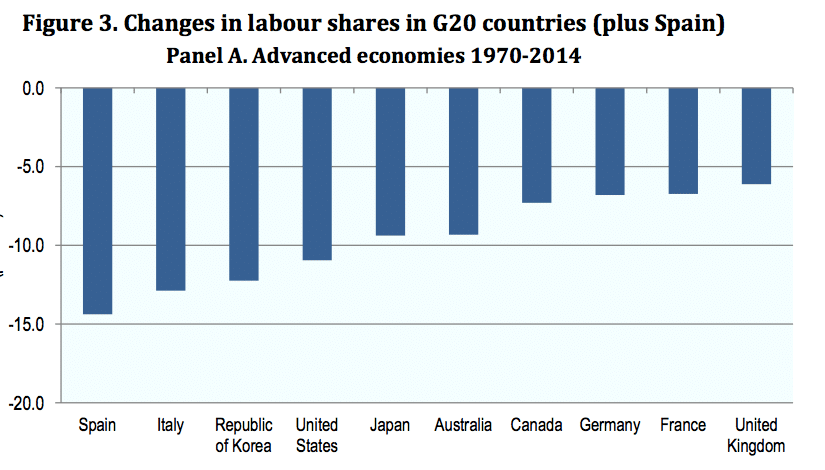
Source: OECD – Labour share in G20 (2015)
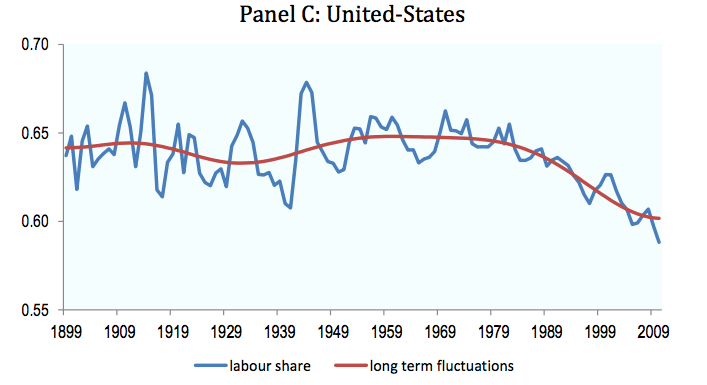
In the US, the labour share was quite consistent until the end of the 1970s, where it began to fall.
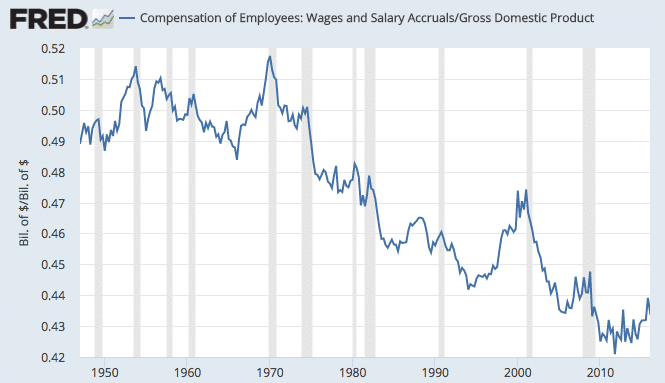
A similar trend can be found using Fred index on labour share – using wages and salaries
US Fred data on Labour share
The fall in labour share is not just a UK/US phenomenon
This shows labour share has fallen in economies, which also have greater labour market protection than UK and US
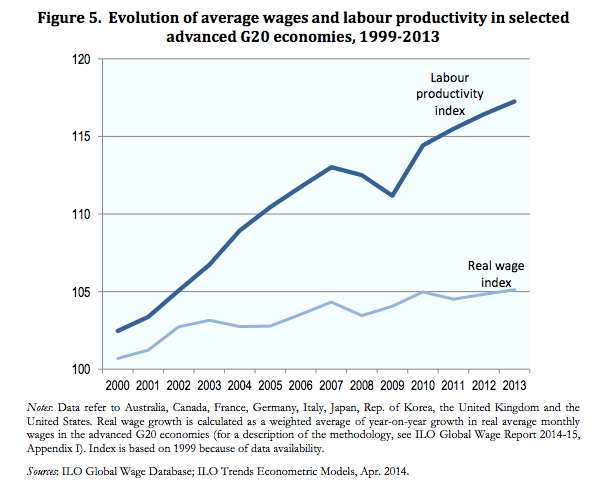
Labour productivity growing faster than real wages – implies falling share of GDP for wages and salaries.
What could be causing falling labour share of GDP?
- The decline in trades unions
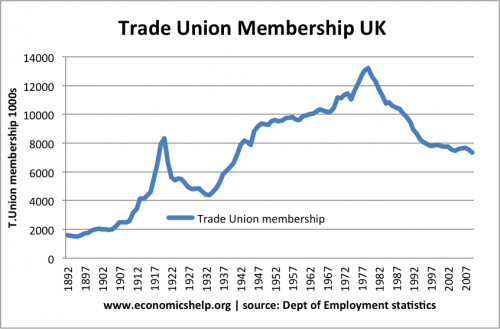
UK labour share peaked in mid-1970s, which was also the peak for trade union membership and trade union influence.
2. Monopsony power
Firms could have increased monopsony power which enables them to restrict wage increases
3. More flexible labour markets.
The UK and US have seen a growth in labour market flexibility – more flexible contracts, zero hour contracts, part-time work. This labour market flexibility makes it harder for workers to demand higher wages.
4. Increased competitive pressures from globalisation
Increasing global product markets means firms are more willing and able to outsource and move production to lower wage cost countries, especially in manufacturing, the developed world has seen a decline in full-time well paid manufacturing jobs. The other peak labour share in the UK was in mid 1920s – just before the General Strike. (This was partly due to overvalued Pound in Gold Standard reducing the profitability of firms. See economy of the 1920s)
Does it matter if labour share falls?
- It depends on how it is used.
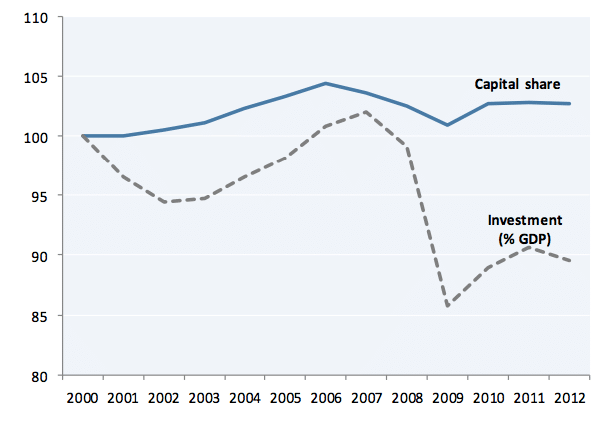
If falling labour share enables increased company investment, then this can enable increased productive capacity in the future and enable rising wages in the future. However, in the OECD investment as a share of GDP has not increased in the past decade.
Capital share and investment share as % of GDP in G20 economies. Source: OECD
Interestingly in emerging economies investment share has risen in same time period. In the case of emerging economies, declining wage share has enabled more investment.
2. Increased retained profit
Companies especially IT companies have seen a rapid rise in profitability and retained profit. Companies like Apple have cash reserves of over $200bn but are struggling to invest. Substantial sums are also kept in off-shore accounts for tax reasons. Cash reserves. This increased retained profit is worrying in that it implies pareto inefficiency because they are savings which could be used to invest in more productive uses.
3. Increased inequality
Fall in share of labour has mirrored rising inequality
4. Better labour relations?
The peak of labour share in the UK was in the 1970s; this was partly caused by powerful unions. However, during this period, there was also many days lost due to industrial unrest – an unproductive situation for the economy.
More data on UK Real GDP vs Real GDP per capita
Real wages

This is GDP per capita vs wages 101 and should be taught to everyone. Excellent.