From 2010 to 2019, total gross government debt (1) increased by £643 bn from £1.2 trillion to £1.8 trillion.
UK Public sector debt
- 2010 – £1,194.3bn
- 2019 – £1,838.2bn
A more helpful statistic is to consider debt as a percentage of GDP
- In 2010 Q2, public sector debt was 64.7% of GDP
- In 2019 Q3 public sector debt is 80.3% of GDP
Debt in comparison over the past four decades
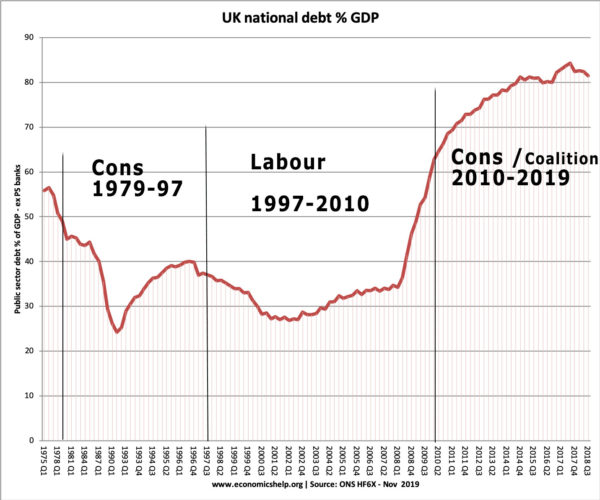
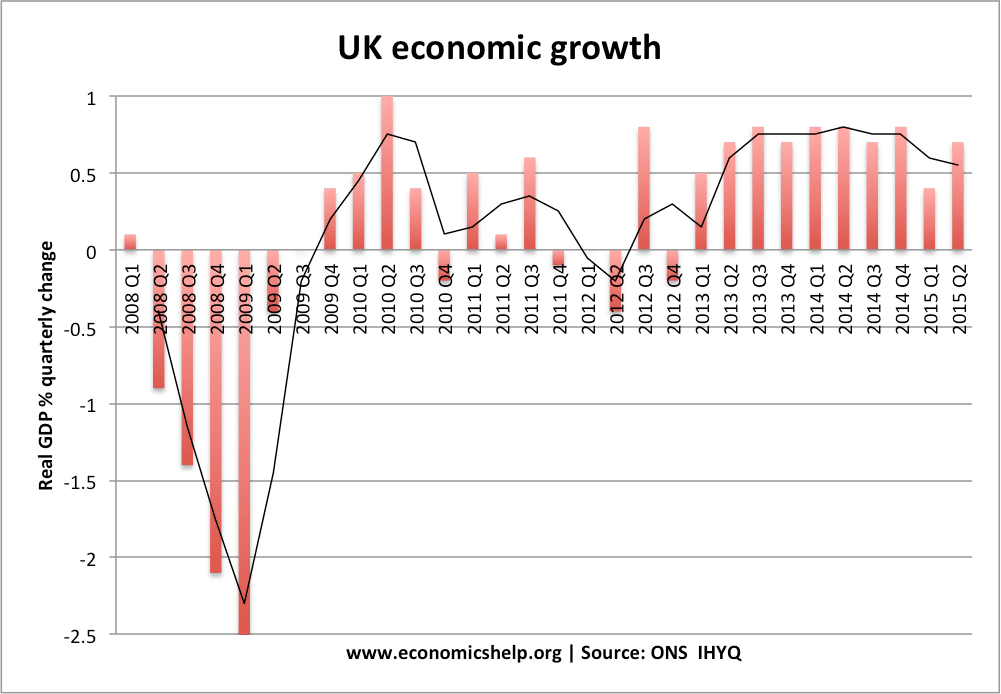
The sharp rise in the national debt that began in 2008 was due to the financial crisis and global recession, which hit tax revenues – especially income tax, VAT, corporation tax and stamp duty (on house sales). The recession also saw a rise in unemployment and other benefits. Pension spending has also increased sharply in the recent period.
When the Conservative party formed a coalition in May 2010, they implemented a policy of austerity, with a squeeze on public spending. In real terms, government spending increased at a slower rate than the previous decade (apart from one year 2011-12 when spending actually fell).
- Changes in government spending 2009-10 + 4.6%
- Changes in Government spending 2010-11 + 0.3%
- Change in government spending 2011-12 -1.5%
UK government spending
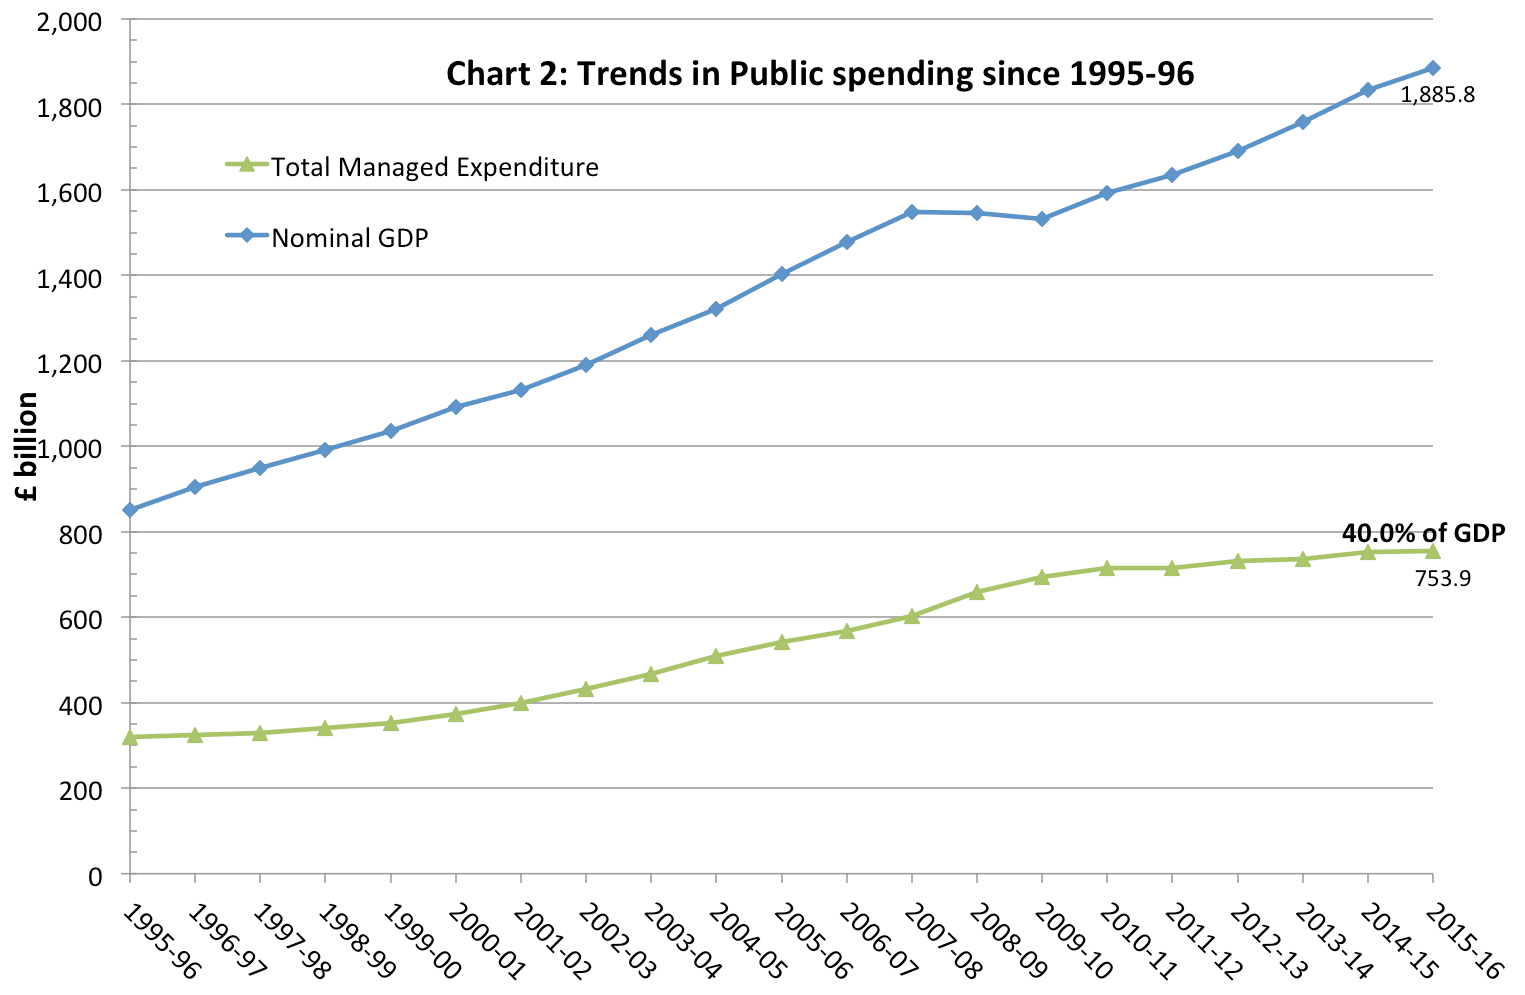
Source: HMT public spending statistics (May 2017)
What is the significance of the rise in government debt 2010-2019?
In a recession, economists (with a few exceptions) state a rise in government borrowing is helpful for providing a fiscal stabiliser. If you try to balance the budget in a recession, it requires higher taxes and spending cuts, which tend to make the recession worse.
A criticism of the Conservative Coalition government in 2010-12 was not that debt increased, but that they didn’t focus on economic recovery – but prioritised deficit reduction at the wrong time. The deflationary fiscal policy proved a drag on the recovery, making it one of the slowest on record. See: Is austerity self-defeating?
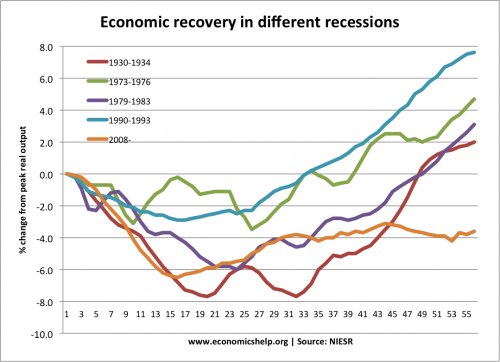
See: Comparing different recessions
Therefore, although annual borrowing was brought down from the peak of 2010/11, economic growth was sluggish – with stagnant real incomes. This slow recovery made it harder to reduce debt to GDP ratio (which is far more useful metric than total level of debt)
Real GDP
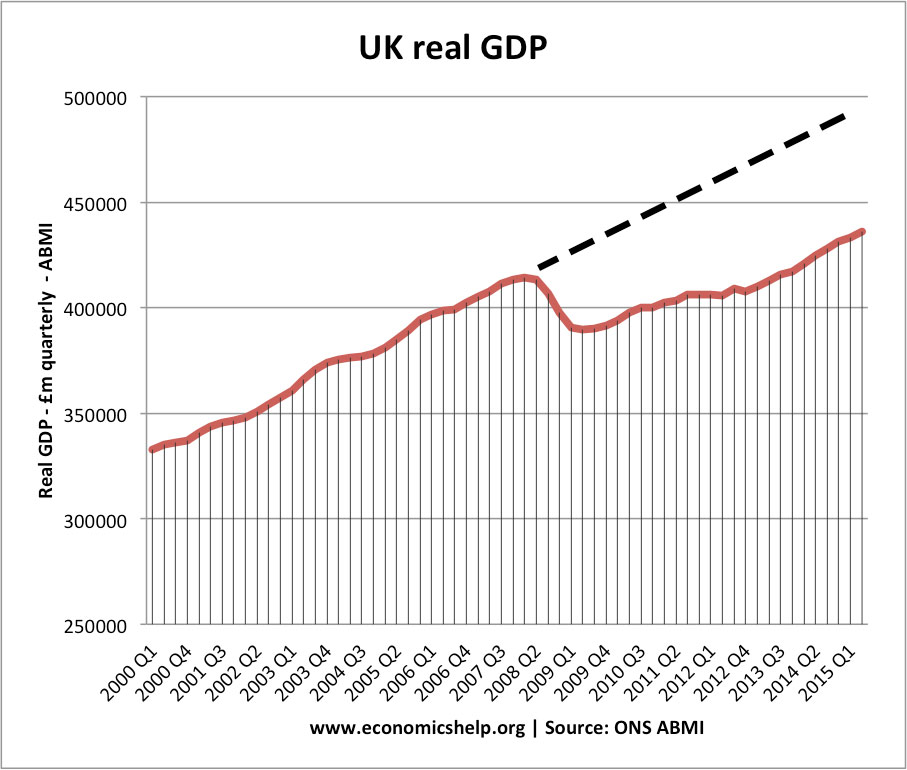
Economic growth
Cost of borrowing
Another issue with net debt is what is the cost of borrowing?
During this period – 2010 to 2019, the cost of borrowing has continued to fall.
Bond yields (10 year – IUMAMNPY) in May 2010 were 3.7. In Aug 2019, 10-year bond yields have fallen to 0.577. In other words, borrowing costs are very low by historical standards. The cost of interest payments is very low.
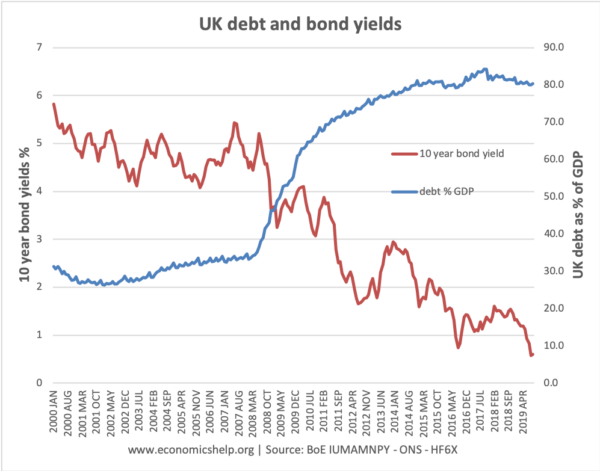
A Conservative chancellor may argue that austerity policies have reassured markets and this is why bond yields are so low. But, a more likely explanation is that the economy is still in a liquidity trap – with interest rates close to zero and a surplus of savings in the economy as businesses are reluctant to invest for several reasons. Around the world (not just the UK) bond yields are at near-record lows – indicating there is high demand for buying relatively safe government bonds. It suggests, should a future government wish to increase borrowing, borrowing costs will be low by historical standards.
Real term trends in public spending
Some departments saw rise in public spending, due to rise in cost of pensions and health care spending. But, this led to cuts in education, local government and public sector investment.

Source: HMT public spending statistics (May 2017)
References
(1) Gross debt here is General government consolidated gross debt BKPX (Maastricht): £m CPNSA
Related pages