Click to enlarge
National debt (public sector debt) is the total amount of liabilities the government owe to the private sector (plus liabilities held by Central Bank). National debt is typically bought by domestic private sector (banks, insurance funds, pension funds) and foreign investors (foreign banks) Recently some has been bought by the Bank of England as part of Asset Purchase Scheme (quantitative easing)
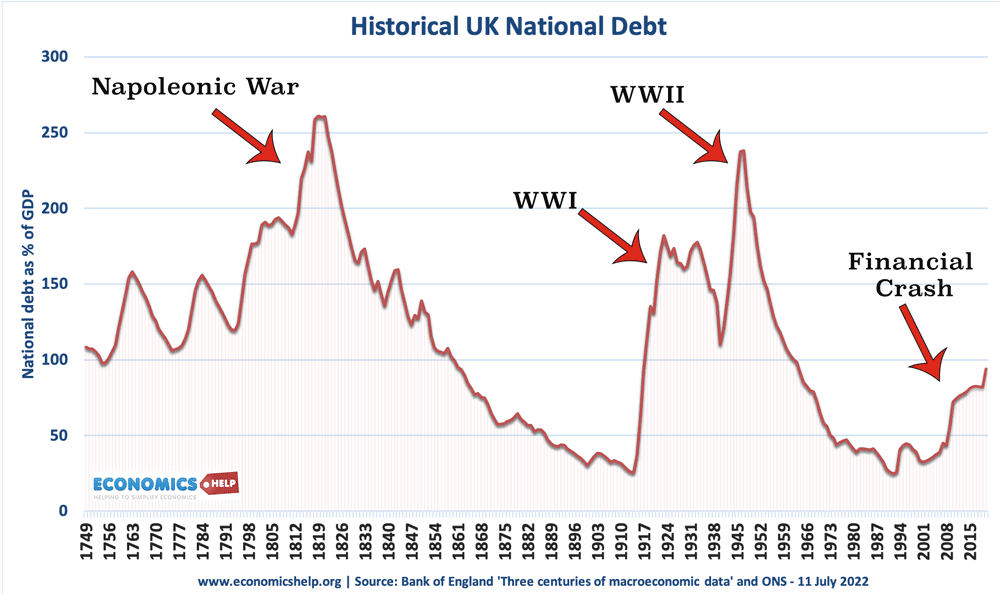
History of UK national debt
In 1694, the first UK debt was issued during the reign of William III. It was offered for a sale by a group of traders and merchants, who formed the Bank of England – which acted as banker for the government. By the end of 1694, the government’s national debt was £1.2 million. The government had to pay an interest of 8% on the loans as the government’s financial situation was considered perilous.
Debt rose rapidly to £50 million in 1720 as the government borrowed to finance the War of the Spanish succession.
Napoleonic Wars
The Napoleonic wars exhausted the British Treasury further as they spent on expensive campaigns in Europe. National debt rose to £1 billion or 200% of GDP.
After the end of the Napoleonic Wars, there was a steady decline in debt to GDP as the Victorian and Edwardian periods prioritised thrift and trying to balance the budget. By 1914, the national debt had fallen to 30% of GDP.
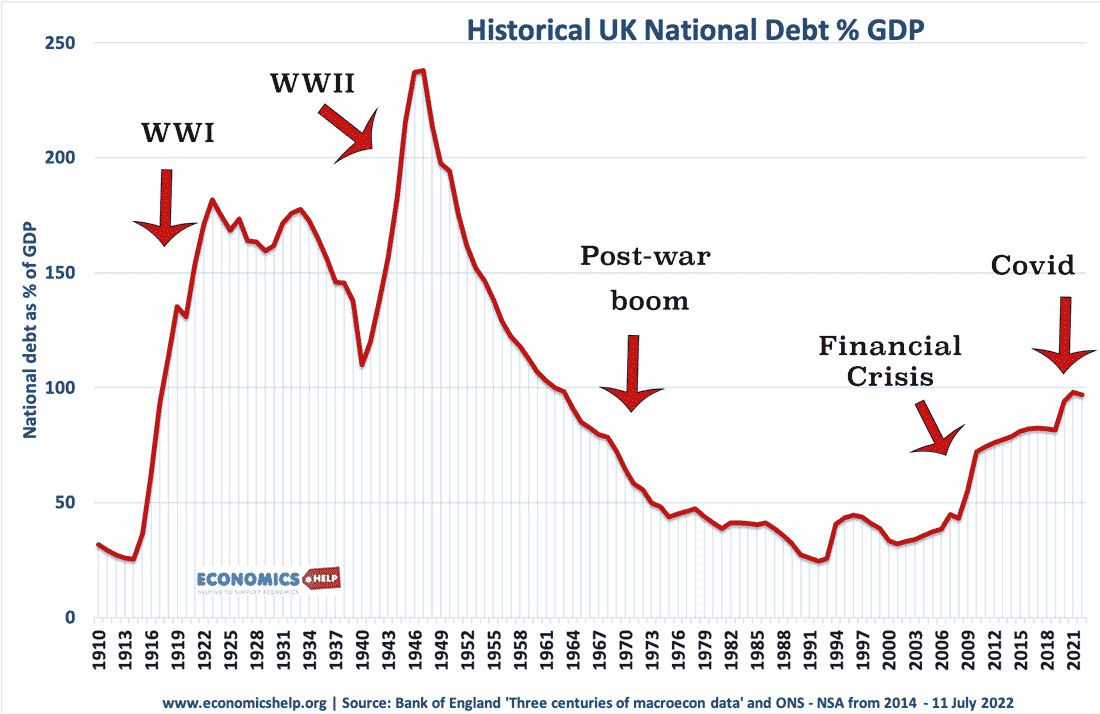
First World War
The First World War vastly increased the size of government spending and borrowing increased significantly. The First World War also saw double-digit inflation, which usually helps to reduce the debt to GDP ratio. The national debt increased from £650 million in 1914 to £7.4 billion in 1919. There was a major campaign by the government to sell war bonds. These bonds had up to 100-year terms, and the last war bonds were not paid off until 2015. The government also borrowed from the United States.
1920s austerity

During the 1920s, the government tried hard to balance the budget and pursued fiscal austerity. However, combined with high-interest rates and an overvalued exchange rate (the UK was in Gold standard at pre-war level), it caused a prolonged period of economic stagnation and deflation. Despite a primary budget surplus, debt to GDP increased in the early 1920s before economic recovery in the late 1930s, caused a fall.
See: Economy of the 1920s
Second World War
During the Second World War, national debt again increased rapidly and the UK borrowed heavily from the US. After the war, national debt continued to rise. This included not just war spending, but also the creation of the welfare state, NHS and major nationalisation programmes. National debt peaked in 1947 at 238% of GDP.
Post-war Boom
However, the prolonged period of economic growth in the post-war period saw a fall in debt to GDP. This fall was also helped by a period of unexpected inflation in the 1970s, which caused nominal GDP to rise fast.
See: Post-war boom
IMF Bailout of 1976
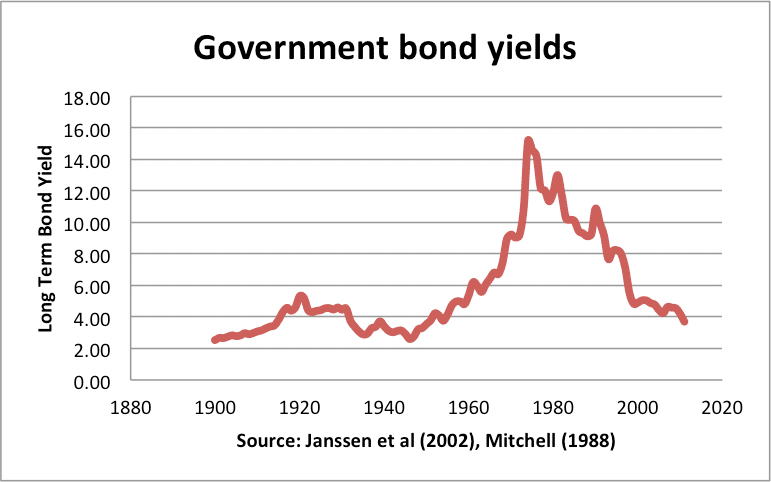
However, despite the prolonged fall in debt as % of GDP, the exception were problems in the 1970s, when in 1976, the government was forced to borrow £3.9 billion from the IMF to stabilise the value of the Pound. The problem was not so much national debt as a combination of a weak Pound, large trade deficit, and high inflation. Because of high inflation, investors were reluctant to buy government bonds (because the real value of bonds could quickly fall during high inflation). The IMF lent the UK money but on the condition of cutting the budget deficit. See: IMF bailout of 1976.
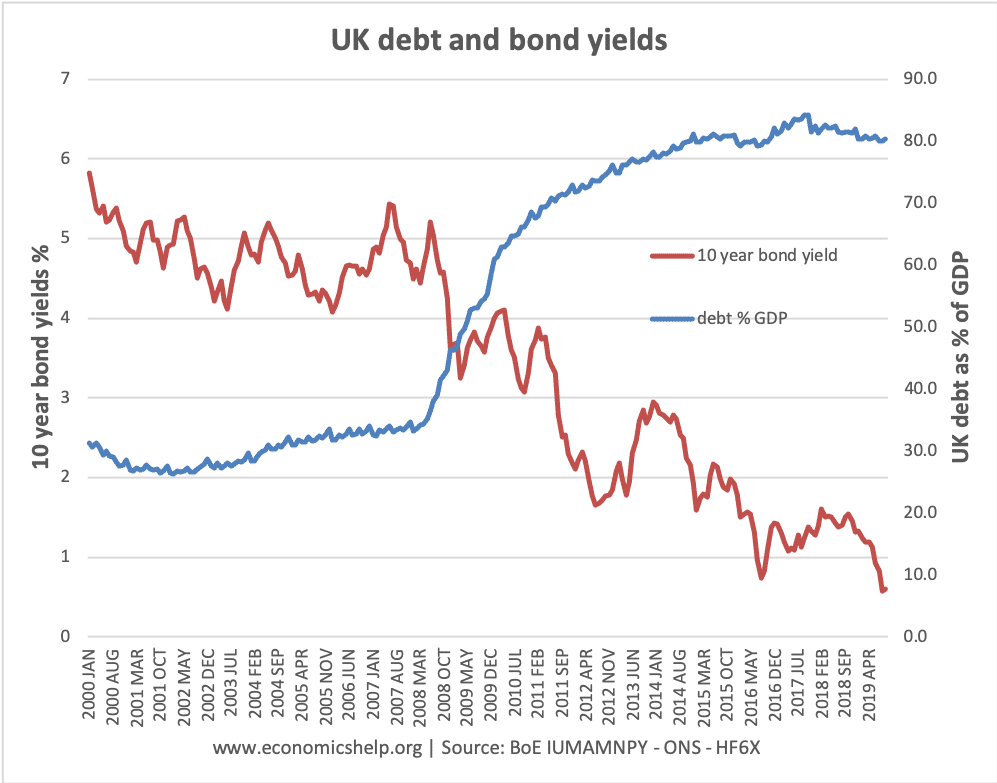
2008 Financial crisis
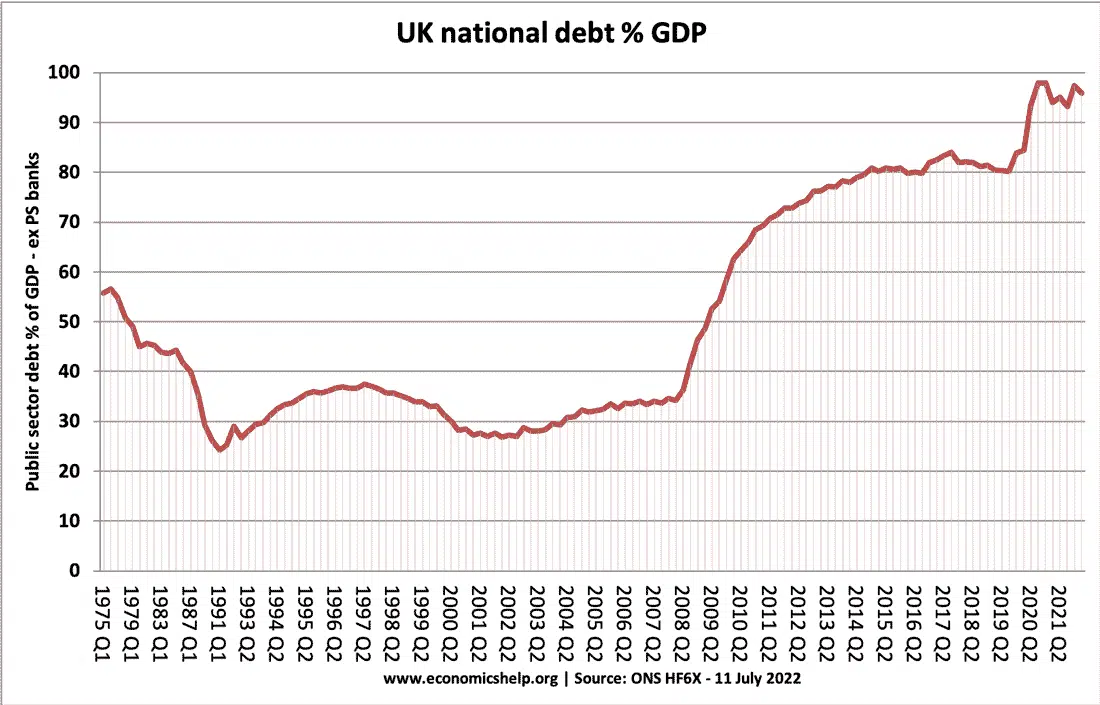
In 2007, National debt was close to 40%, but the 2008 financial crisis caused a deep recession and a fall in tax revenues. National debt doubled in a short period of time. From 2010, there was relative austerity pursued by the government, which was a factor in contributing to weak economic growth.
2020 Covid-19 impact on debt
The economic shutdown of 2020, led to another sharp rise in debt. The combination of economic contraction, large government welfare payments and falling tax revenues, saw the national debt rise significantly.
Interest on UK national debt as a £ of GDP
Interest payments on UK national debt is related to the size of the debt and the interest rate (bond yield) the government is paying on the debt it issues.
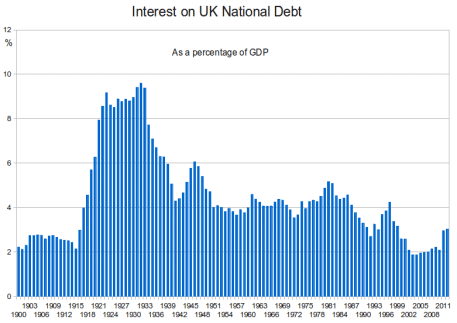
This shows debt interest payments as a share of GDP where very high in the 1920s and 30s. This reflects both high debt, but also relatively high interest rates. By contrast in 2020, interest rates are close to 1%
This shows national debt as a share of government revenue. (Government revenue is roughly 40% of GDP) so it is a different measure. It shows how debt interest payments as a share of revenue and GDP have fallen in recent years due to very low interest rates.
Annual borrowing

National (or public sector) debt is the total cumulative amount owed by the government to the private sector. The annual budget deficit is the amount the government have to borrow in a year.
Notes on Data
There are different measures of national debt, and different ways of recording. Some data sets may give different figures.
The graph at the top I used data in the Bank of England “A millennium of macroeconomic data“. I had previously used data from the Bank of England “Three Centuries of data” which gave higher national debt to GDP for the mid-1800s.
Forecast for future

Source: Fiscal risks and sustainability – OBR
The OBR has forecast that, on our given trajectory, UK public sector debt could reach 350% of GDP within 50 years.
Related
Dear Tejvan,
Can you please check the time line in the paragraph of the First World War? I can not believe that they were paid off in 1915 as stated.
cheers 2015!
Your explanations of economics are the best I have ever found. Thank you very much and please keep up the great work.
Is it time to update the National Debt figures or are you perhaps waiting for the economy to settle back down after Covid spending?
Best wishes,
Francis Cubitt
Listing debt as a % of GDP is misleading because although the debt looks like it is going down…..it is often still going up…….Can we have a chart that shows the increased amount the UK owes and has grown since the war.
Listing absolute values would be misleading because it doesn’t take account of inflation or the size of the economy.
Have you noticed every time the conservatives get in power the National debt rises. And they tell the people that Labour can’t run the economy and they borrow too much !! The people need to wake up and realise this right wing propaganda is fooling them every time.