Since the great financial crash of 2007, the UK economy has struggled. Although the past 15 years have been challenging from a global perspective, compared to many international competitors, the UK has slipped behind.
Economic growth before global financial crisis of 2007-09 was 2.7%, the new normal is now closer to just 1.5% and with the economy heading into recession, it is likely to get worse before it gets better.
One of the great manifestations of the UK’s poor economic performance is its historically low real wage growth.
Median wage growth is important because it reflects typical wages, rather than GDP per capita which might be distorted by a few top earning workers or companies.
This shows how the UK has fallen behind other countries in wage growth. The only major country with worse wage growth is Japan, which witnessed a median wage growth of 1.4% during this period.
The UK’s poor performance
Average median disposable income is important as it gives a better indication of living standards that GDP per capita which can be distorted by company profit, (e.g. high oil prices increasing oil output) or higher incomes at the top of the income spectrum.
Real national income excluding North Sea. Source Bank of England.
Reasons for UK Economic Decline?
Deindustrialisation The early 1980s saw a repid decline in UK manufacturing. This was due to two factors
Monetarism of Mrs Thatcher’s government – High-interest rates and tight fiscal policy to bring inflation under control led to deep recession. Combined with the rapid appreciation of Sterling due to high-interest rates and the discovery of oil in the north sea. This made UK manufacturing uncompetitive and also highlighted a lack of flexibility and competitiveness.
The long-term malaise of British industry in the post-war period characterised by poor industrial relations, low investment and poor take-up of new management techniques.
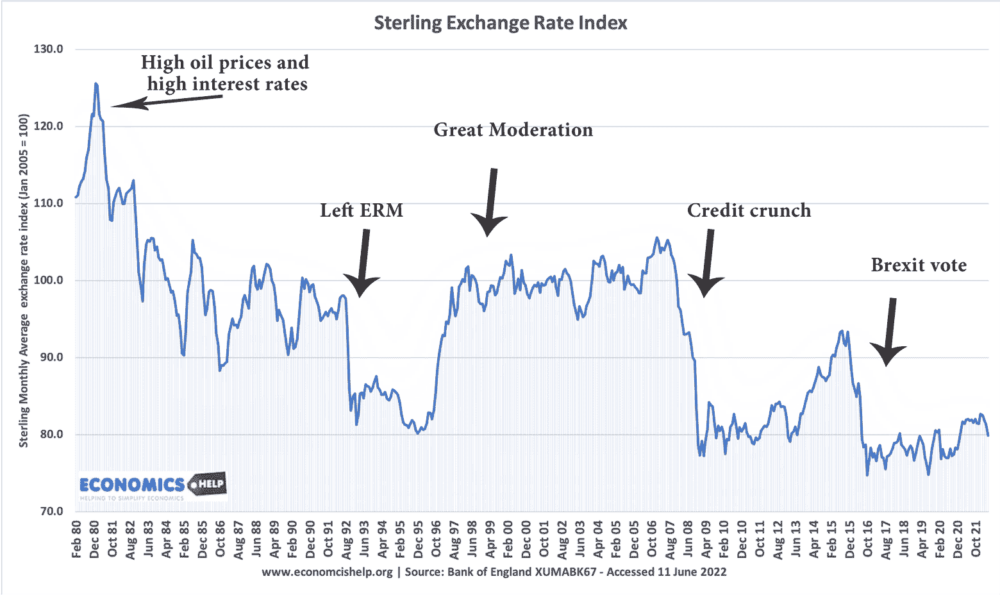
Reliance on financial services. Deregulation of financial services. In 1986 Mrs Thatcher’s government introduced the Financial services deregulation Act also known as the “Big Bang”. This deregulated many financial services, leading to strong growth in the size of the city, which excelled in a new range of financial instruments, such as derivates and credit default swaps. The deregulation helped London consolidate its position as a major international centre. However, this meant that when the credit crunch hit the financial system in 2007, the UK economy was heavily exposed. The sharp fall in the Sterling highlights how markets readjusted to the financial crisis.
A near 30% depreciation in Sterling exchange rate index in 2007/08 illustrated the UK’s exposure to a financial crisis.
Low productivity growth
Although global productivity growth has stalled, the decline in UK productivity has been more striking.
Post-war the UK’s productivity growth was around 2.5%. Between Q1 2007 and Q2 2022, productivity has grown by just 6.4% over 15 years – an average growth rate of 0.4%
Some of the reasons for the slowdown in productivity are shared on a global scale
Demographic changes – an ageing population (though actually UK is less affected by declining birth rate than many OECD countries.
Slowing technological innovation. No major breakthroughs and diminishing returns in scientific development.
Some issues specific to the UK include
Low adoption of new technologies, such as robot automation. UK is only in 24th position in the global league of robot densities, behind countries including Slovenia, Slovakia and the Czech Republic. (all countries with strong growth in media wages.) (link)
Low business investment
According to the CBI, business investment in the UK has fallen from 14.7% of GDP in 1989, to a low of 10% at end of 2019. And since 2019, it has fallen further.
“Between 2021-2025, the UK Government is projected to invest an average of 3.4% of GDP, compared to 3.9% in the US, 4.1% in Canada, 5.9% in Japan and 9.0% in China.
Total investment which includes both private and public investment, shows the UK lagging behind major economies.
Whilst China has over-invested in a real estate bubble. The UK’s relatively low level of investment does raise concerns for the future, especially over the lack of investment in renewable energy and green technology which will be increasingly important in the future.
The CBI identify issues with poor vocational training in the UK. They state as the economy develops 90% of the workforce will need to learn new skills, and it will cost an additional £13bn a year simply to stop skills gaps from worsening. In the public spending cuts of 2010 onwards, the education budget was squeezed more than other protected departments.
Depreciation in Sterling
The long-term depreciation in Sterling is fundamentally a reflection of the UK’s declining competitiveness. In the short term, the exchange rate can be influenced by temporary factors, such as interest rates, confidence and speculation. But, the long-term driver in exchange rates is relative inflation rates. If UK inflation is relatively higher than competitors then there will be a depreciation in Sterling as UK goods are less attractive. The problem is that on using real exchange rate measures, Sterling’s recent fall is not overdone, in fact, there is further to fall.
The austerity of the 2010s, discouraged growth and investment at a time of weaker economic growth. Creating a cycle of budgetary pressures and low investment.
This shows how the UK lags behind other countries in low levels of investment.
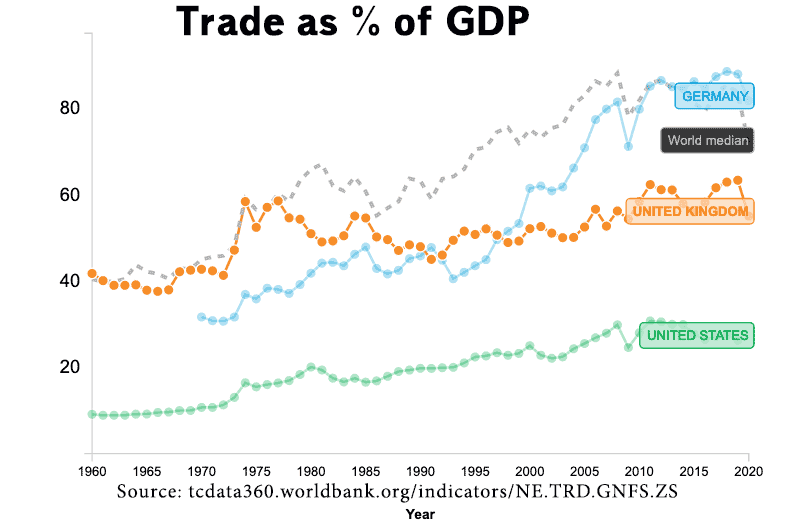
The UK is an economy historically based on trade. In the mid-1970s, UK trade accounted for 60% of GDP – above Germany and the United States. Since that peak, trade as a share of GDP has declined and has been overtaken by Germany.
Given the importance of trade and the fact 50% of trade is with European Union, the decision to leave the single market and customs unions have added extra frictions, which is causing the UK to lose out on exports
Early research by the OBR shows UK goods export volumes hit by the leaving of the Single Market.
Labour Participation
Labour market participation has been hampered by the loss of EU workers following Brexit, (though to some extent compensated by non-EU migrants). But, also rise in early retirement and long-term inactivity due to sickness.
Long term decline
In the nineteenth century, the UK was the largest economy in the world. In 1900, the UK was the most industrialised economy in the world – 40% more industrialised than the 2nd biggest economy United States.
Post-war decline
In 1950, 25% of world Exports were British, but over the post-war period, the UK declined relatively. This was partly due to the ‘catch-up’ theory. Germany and Japan bouncing back from disaster of the Second World War. But, there was evidence of low investment and low take up of new dynamic technologies. UK industrial relations were poor with many hours lost to strikes and the disharmony making it difficult for more efficient management techniques and boosting labour productivity.
UK education also slipped behind, especially in vocational training. By the early 1980s, some 80% to 90% of school leavers in France and West Germany received vocational training, compared with only 40% in the United Kingdom.
“British factory managers preferred to operate in a cycle of under-investment, limited research and development, low wages and a shrinking pool of clients, rather than risk a fresh start with new products in new markets.”
Idiots get what they vote for. Long term decline of a failing nation. Demented Xenophobes still have rose tinted views of the ‘days of the Raj’ that fuels manic delusions of grandeur. The reality is that the U.K. is an irrelevant pest that EU are glad to shed. Brexit has been great …for the EU. The fact that anyone could even persist with a plan to make the country poorer, worse off in every conceivable way should be grounds for sectioning people. Stupid gullible fools believing Tory crap should be proud of the s-hole they have contributed to that is now Brexit Shitain. A place where nothing and no one works. Tax haven for the world’s corrupt and over taxed, poor value hole in the map for its residents.


Idiots get what they vote for. Long term decline of a failing nation. Demented Xenophobes still have rose tinted views of the ‘days of the Raj’ that fuels manic delusions of grandeur. The reality is that the U.K. is an irrelevant pest that EU are glad to shed. Brexit has been great …for the EU. The fact that anyone could even persist with a plan to make the country poorer, worse off in every conceivable way should be grounds for sectioning people. Stupid gullible fools believing Tory crap should be proud of the s-hole they have contributed to that is now Brexit Shitain. A place where nothing and no one works. Tax haven for the world’s corrupt and over taxed, poor value hole in the map for its residents.